Figures & data
Table 1 Respondent demographics and health characteristics by caregiver status
Figure 1 Work productivity loss and activity impairment by caregiver status post-propensity matching.
Notes: *P-values reflect significant differences compared with schizophrenia caregiver; ^includes employed respondents only. Means with 95% confidence intervals are presented. The matched noncaregiver and other caregiver groups were matched on age, sex, marital status, education, household income, employment status, BMI, smoking status, alcohol consumption, exercise behaviors, and the CCI.
Abbreviations: BMI, body mass index; CCI, Charlson comorbidity index.
Abbreviations: BMI, body mass index; CCI, Charlson comorbidity index.
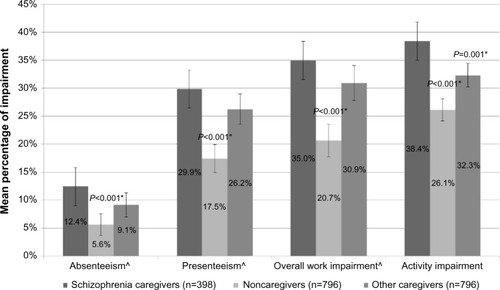
Figure 2 Proportion of emergency room visit and hospitalizations by caregiver status post-propensity matching.
Notes: *P-values reflect significant differences compared with schizophrenia caregiver. The matched noncaregiver and other caregiver groups were matched on age, sex, marital status, education, household income, employment status, BMI, smoking status, alcohol consumption, exercise behaviors, and the CCI.
Abbreviations: BMI, body mass index; CCI, Charlson comorbidity index.
Abbreviations: BMI, body mass index; CCI, Charlson comorbidity index.
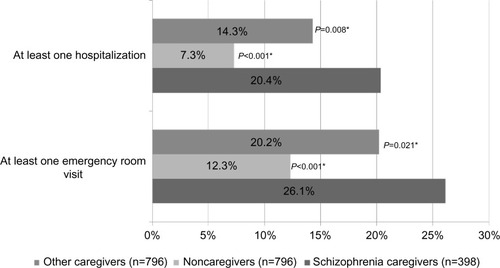
Figure 3 Health care resource utilization by caregiver status post-propensity matching.
Notes: *P-values reflect significant differences compared with schizophrenia caregiver. Means with 95% confidence intervals are presented. The matched noncaregiver and other caregiver groups were matched on age, sex, marital status, education, household income, employment status, BMI, smoking status, alcohol consumption, exercise behaviors, and the CCI.
Abbreviations: BMI, body mass index; CCI, Charlson comorbidity index.
Abbreviations: BMI, body mass index; CCI, Charlson comorbidity index.
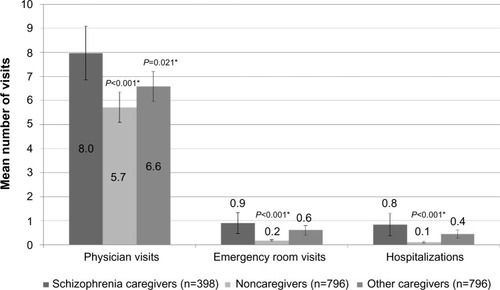
Figure 4 Indirect costs by caregiver status post-propensity matching.
Notes: *P-values reflect significant differences compared with schizophrenia caregiver; ^includes employed respondents only, total indirect costs are the combination of absenteeism and presenteeism costs. Means with 95% confidence intervals are presented. The matched noncaregiver and other caregiver groups were matched on age, sex, marital status, education, household income, employment status, BMI, smoking status, alcohol consumption, exercise behaviors, and the CCI.
Abbreviations: BMI, body mass index; CCI, Charlson comorbidity index.
Abbreviations: BMI, body mass index; CCI, Charlson comorbidity index.
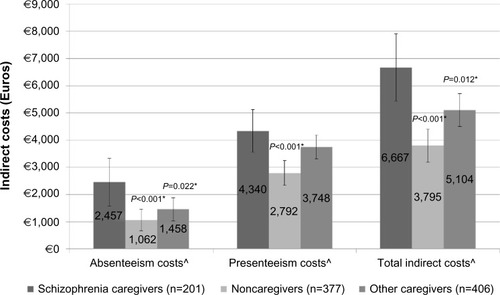
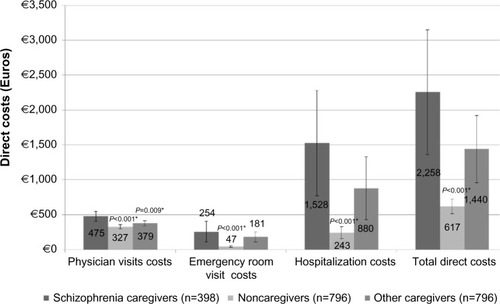
Figure 5 Direct costs by caregiver status post-propensity matching.
Notes: *P-values reflect significant differences compared with schizophrenia caregiver, total direct costs are the combination of physician visit, ER visit, and hospitalization costs. Means with 95% confidence intervals are presented. The matched noncaregiver and other caregiver groups were matched on age, sex, marital status, education, household income, employment status, BMI, smoking status, alcohol consumption, exercise behaviors, and the CCI.
Abbreviations: BMI, body mass index; CCI, Charlson comorbidity index; ER, emergency room.
Abbreviations: BMI, body mass index; CCI, Charlson comorbidity index; ER, emergency room.