Figures & data
Figure 1 Health states in the economic model.
Abbreviations: CRNM, clinically relevant nonmajor; CV, cardiovascular; ECH, extracranial hemorrhage; ICH, intracranial hemorrhage; GI, gastrointestinal; NVAF, nonvalvular atrial fibrillation.
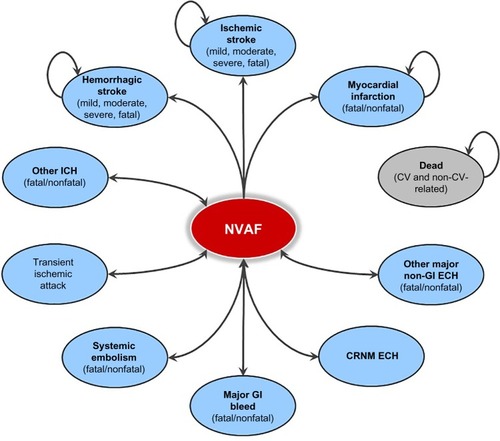
Table 1 Patient characteristics, clinical event rates, and stroke-severity distribution
Table 2 Mortality estimates for model inputs
Table 3 Health state utilities and disutilities
Table 4 Cost inputs
Table 5 Analysis results
Table 6 Results of one-way sensitivity analyses
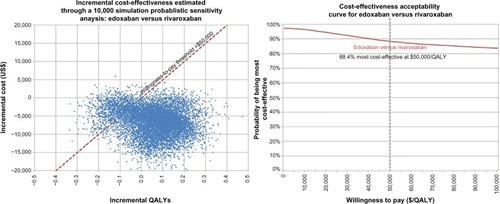
Figure 2 Results of the probabilistic sensitivity analysis.
Abbreviation: QALYs, quality-adjusted life years.