Figures & data
Figure 1 The flow diagram of the study.
Abbreviations: BMD, bone mineral density; DXA, dual-energy X-ray absorptiometry; OSTA, Osteoporosis Self-Assessment Tool for Asians; FRAX, fracture risk assessment tool.
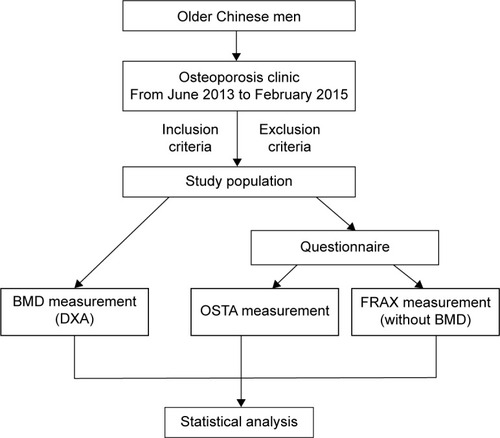
Table 1 Summary of descriptive characteristics of the fracture and control groupsTable Footnotea
Table 2 BMD T-score, OSTA, and FRAX scores of the fracture and control groups
Figure 2 Proportions of BMD T-scores at different sites in the fracture and control groups, and ROC curve of the BMD measurement at different sites for identifying PNOVFs with optimal cutoff value.
Notes: 1: Fracture group; 2: control group. *P-value for comparison <0.05.
Abbreviations: BMD, bone mineral density; ROC, receiver-operating characteristic; PNOVFs, painful new osteoporotic vertebral fractures.
Abbreviations: BMD, bone mineral density; ROC, receiver-operating characteristic; PNOVFs, painful new osteoporotic vertebral fractures.
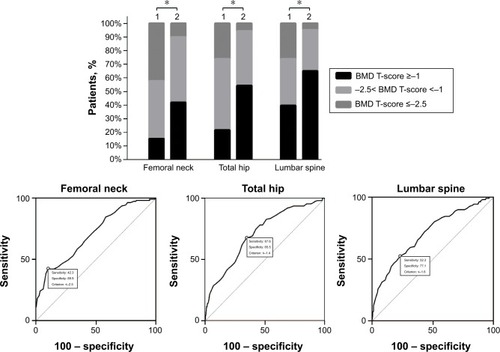
Table 3 AUC and sensitivity and specificity values of the FRAX, BMD T-score, and OSTA for identifying PNOVFs
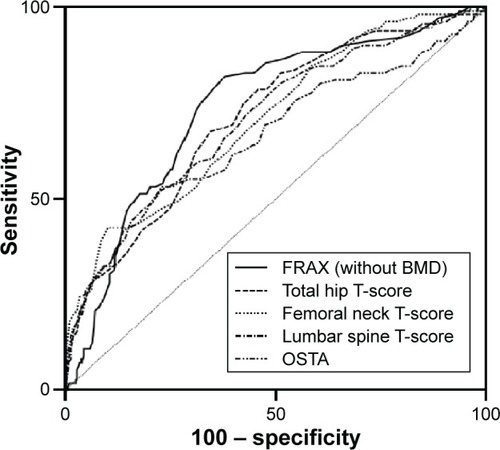
Figure 3 Comparison of different AUCs (BMD T-score, OSTA, and FRAX for identifying PNOVFs).
Abbreviations: BMD, bone mineral density; OSTA, Osteoporosis Self-Assessment Tool for Asians; FRAX, fracture risk assessment tool; PNOVFs, painful new osteoporotic vertebral fractures; AUCs, areas under the receiver-operating characteristic curve.