
Figures & data
Figure 1 Flow diagram of the study according to the CONSORT statement.
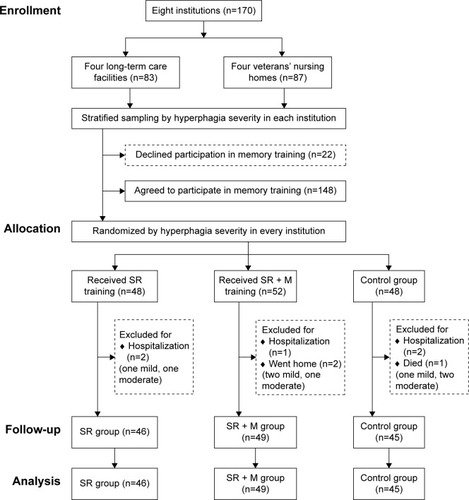
Table 1 Demographic data (N=140)
Table 2 Comparison of the 6-month follow-up data of the three groups using generalized estimating equation (N=140)
Table 3 Comparison of the 6-month follow-up data of all the frequencies of four categories of hyperphagic behaviors using generalized estimating equation (N=140)
Table 4 Comparison of the 6-month follow-up data of recall scores on the MMSE among the three groups using generalized estimating equation (N=140)
Table 5 Comparisons between the SR and SR + M groups of recall performance: longest recall intervals (N=95)
Figure S1 Memory training: Phase II process flow.
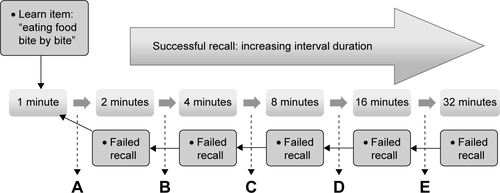
Table S1 Example of memory training protocols between SR group and SR + M group (learn item: “Eating food bite by bite”)