
Figures & data
Table 1 Participants’ characteristics
Table 2 Participants’ clinical characteristics in three age groups
Table 3 CIMT in male and female patients
Figure 1 CIMT (median) changes with age in female and male patients.
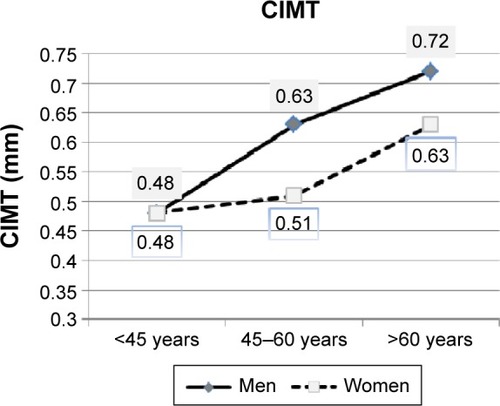
Figure 2 Correlation diagram of CIMT and age in male and female patients.
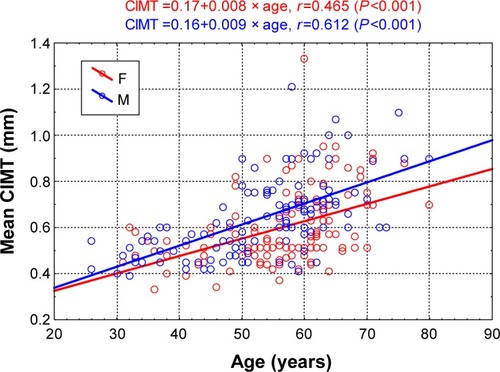
Table 4 Linear regression analysis results for variables characterizing the participants (independent variables) and CIMT
Table 5 Multiple regression analysis results for variables characterizing the 256 participants (independent variables) and CIMT
Table 6 Multiple regression analysis results for variables characterizing the 134 female participants (independent variables) and CIMT
Table 7 Multiple regression analysis results for variables characterizing the 122 males (independent variables) and CIMT