
Figures & data
Figure 1 Flowchart for study eligibility.
Abbreviations: PCI, percutaneous coronary intervention; PPCP, post-PCI chest pain; cTnI, cardiac troponin I; MI, myocardial infarction.
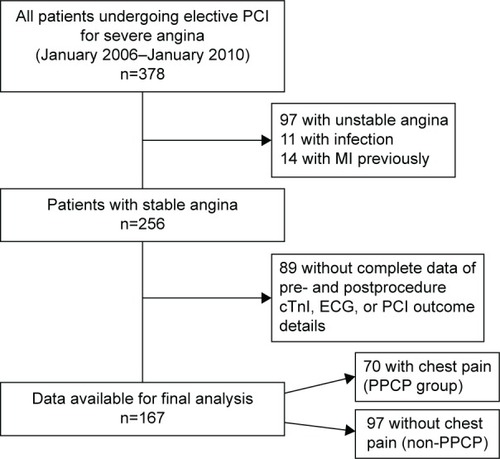
Table 1 Baseline demographic and clinical characteristics in the PPCP versus non-PPCP groups
Table 2 PCI and short-term characteristics in the PPCP versus non-PPCP groups
Figure 2 The proportion of patients with or without cTnI elevation and/or abnormal post-PCI ECG in 70 PPCP patients.
Abbreviations: PCI, percutaneous coronary intervention; PPCP, post-PCI chest pain; cTnI, cardiac troponin I; ECG, electrocardiogram.
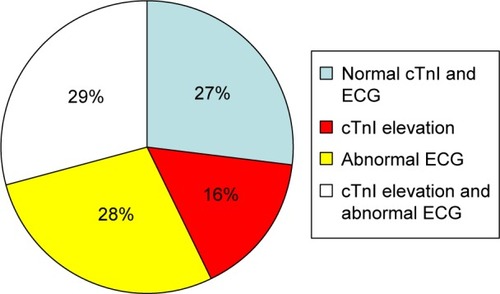
Table 3 Predictors of post-PCI chest pain in patients with stable angina
Table 4 Factors associated with post-PCI chest pain by logistic regression analysis