
Figures & data
Table 1 Basic characteristics of the subjects
Table 2 BMD (T score) and OP morbidity in males and females after age-stratified adjustment
Figure 1 Comparison of age-related BMD changes between male and female in lumbar spine.
Abbreviation: BMD, bone mineral density.
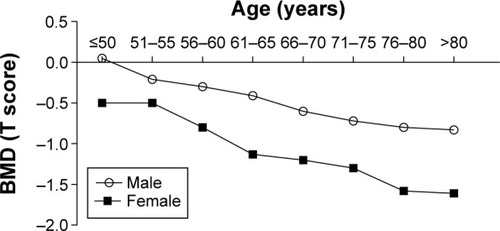
Figure 2 Comparison of age-related OP morbidity changes between male and female in lumbar spine.
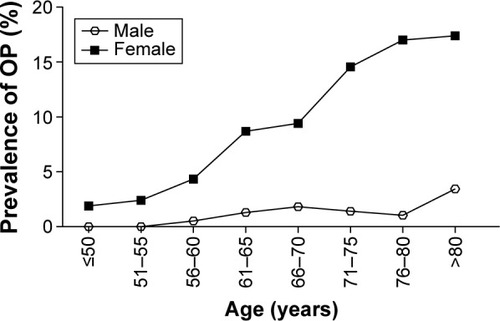
Table 3 Differences in basic characteristics in males according to bone health classification
Table 4 Differences in basic characteristics in females according to bone health classification
Table 5 Frequency of BMI, FBG, PBG, and HbA-1c in males and females with OP
Table 6 Frequency of lipid profiles in males and females with OP
Table 7 Correlation coefficients among age, height, weight, BMI, waistline, hipline, FBG, HDL-C, LDL-C, TC, TG, and OP in males and females