Figures & data
Table 1 Characteristics of included randomized controlled trials comparing GPi DBS with STN DBS for advanced Parkinson’s disease
Figure 1 Flow diagram of selection of RCTs.
Abbreviations: RCTs, randomized controlled trials; DBS, deep brain stimulation.
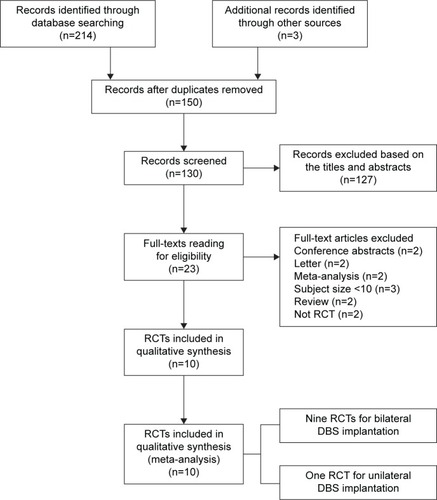
Figure 2 Risk of bias graph.
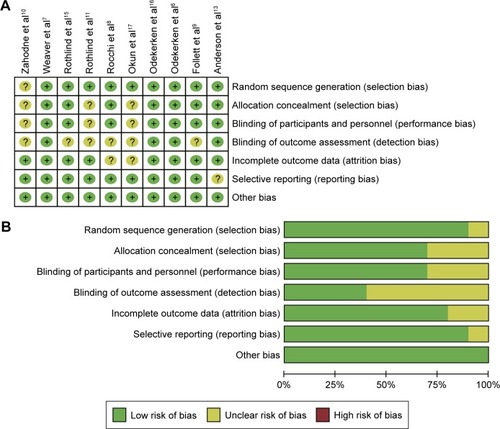
Figure 3 Forest plot of mean difference of UPDRS-III score in the off-medication/on-stimulation state, stratified by follow-up length.
Abbreviations: UPDRS-III, unified Parkinson’s disease rating scale III; GPi, globus pallidus interna; STN, subthalamic nucleus; IV, inverse variance; CI, confidence interval.
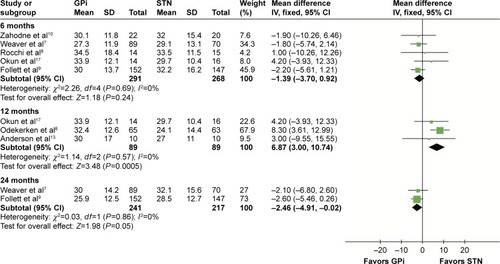
Figure 4 Forest plot of mean difference of UPDRS-III score in the on-medication/on-stimulation state, stratified by follow-up length.
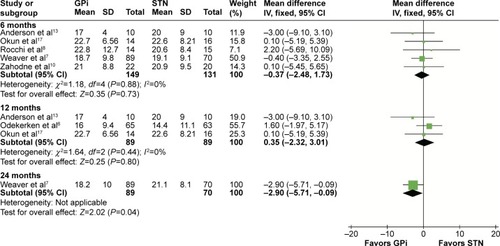
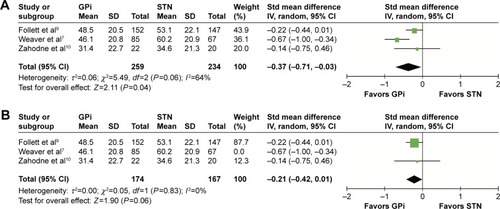
Figure 5 Forest plot of standardized mean difference of levodopa equivalent doses.
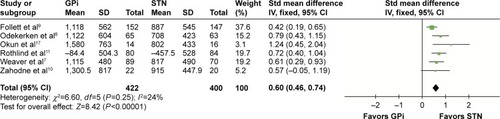
Figure 6 Forest plot of standardized mean difference of Beck Depression Inventory II.
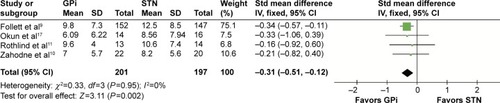
Table 2 Entire results of neurocognitive status comparison between GPi DBS and STN DBS
Figure 7 Forest plot of standardized mean difference of semantic fluency test.
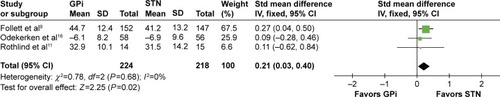
Table 3 Entire results of quality of life comparison between the two targets
Figure 8 Forest plot of standardized mean difference of the subscale “communication”.
Abbreviations: GPi, globus pallidus interna; STN, subthalamic nucleus; IV, inverse variance; CI, confidence interval; Std, standardized.