Figures & data
Figure 1 Flowchart of study participants.
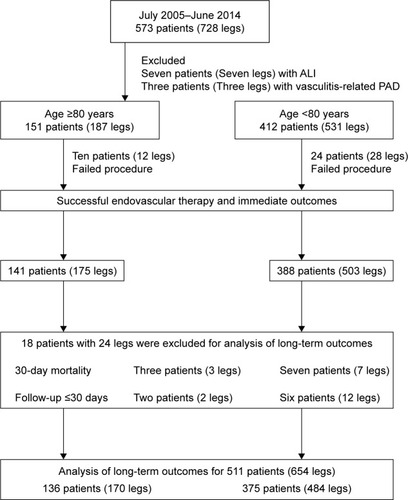
Table 1 Baseline demographics
Table 2 Characteristics of the affected limb
Table 3 Thirty-day outcomes and changes in functional status after EVT
Table 4 Crude and significant multivariate risk factors for long-term events
Figure 2 Kaplan–Meier curves for overall survival.
Notes: The survival rates for octogenarians and nonoctogenarians were 63% and 73% at 3 years and 45% and 67% at 5 years, respectively (P=0.004). Yellow line and blue line represent octogenarians and nonoctogenarians, respectively.
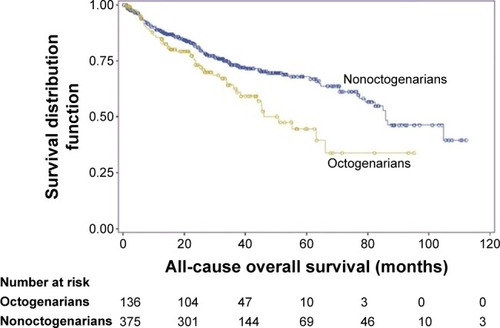
Figure 3 Kaplan–Meier curves for freedom from major cerebrovascular and cardiovascular events (MACCEs).
Notes: The rates of 3-year freedom from MACCEs were similar between groups (50% in octogenarians vs 55% in nonoctogenarians, P=0.564). Yellow line and blue line represent octogenarians and nonoctogenarians, respectively.
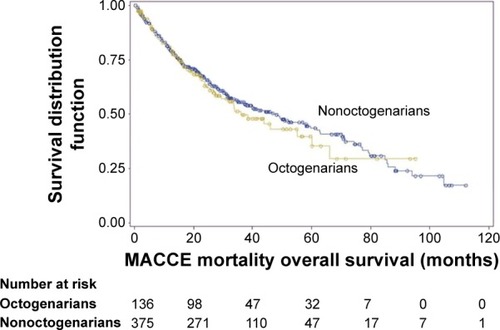
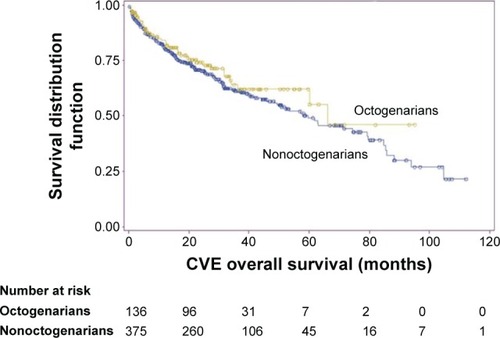
Figure 4 Kaplan–Meier curves for freedom from composite vascular events (CVEs).