
Figures & data
Table 1 Inclusion and exclusion criteria for this study
Table 2 Regression coefficients for the final multivariate model
Figure 1 ROC and sensitivity and specificity values of BFH-OST for diagnosis of osteoporosis (T-score ≤−2.5SD).
Notes: (A) AUC and (B) sensitivity and specificity values of BFH-OST for the diagnosis of osteoporosis (T ≤–2.5) using BMD measurement. *Optimal BFH-OST index cutoff.
Abbreviations: BFH-OST, Beijing Friendship Hospital Osteoporosis Self-Assessment Tool; AUC, area under the curve; CI, confidence interval; +LR, positive likelihood ratio; –LR, negative likelihood ratio; WHO, World Health Organization; BMD, bone mineral density; ROC, receiver operating characteristic curve; SD, standard deviation.
Abbreviations: BFH-OST, Beijing Friendship Hospital Osteoporosis Self-Assessment Tool; AUC, area under the curve; CI, confidence interval; +LR, positive likelihood ratio; –LR, negative likelihood ratio; WHO, World Health Organization; BMD, bone mineral density; ROC, receiver operating characteristic curve; SD, standard deviation.
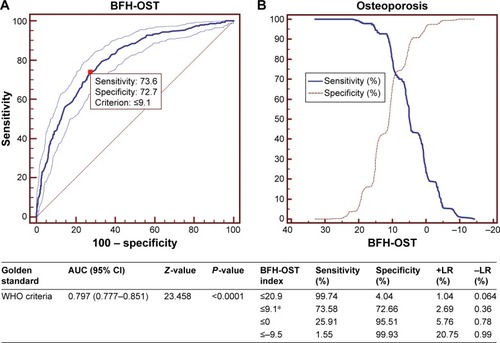
Table 3 Summary of descriptive characteristics of the study cohort (n=1,721)
Figure 2 Distribution of T-scores of different sites by BFH-OST.
Abbreviation: BFH-OST, Beijing Friendship Hospital Osteoporosis Self-Assessment Tool.
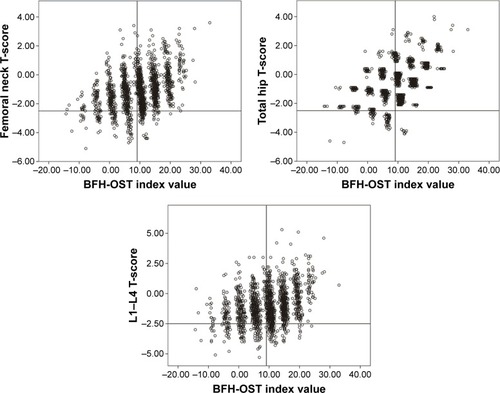
Figure 3 The comparison between OSTA and BFH-OST for the diagnosis of osteoporosis (T-score ≤−2.5).
Abbreviations: BFH-OST, Beijing Friendship Hospital Osteoporosis Self-Assessment Tool; OSTA, Osteoporosis Self-assessment Tool for Asians; AUC, area under the curve; CI, confidence interval.
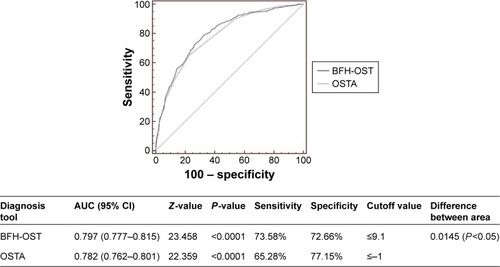
Table 4 Distribution of test results for BFH-OST based on either femoral neck or total hip or lumbar spine BMD in the study cohort (n=1,721 females)