Figures & data
Figure 1 Mean air conduction hearing threshold.
Note: Error bars represent standard deviations (SDs).
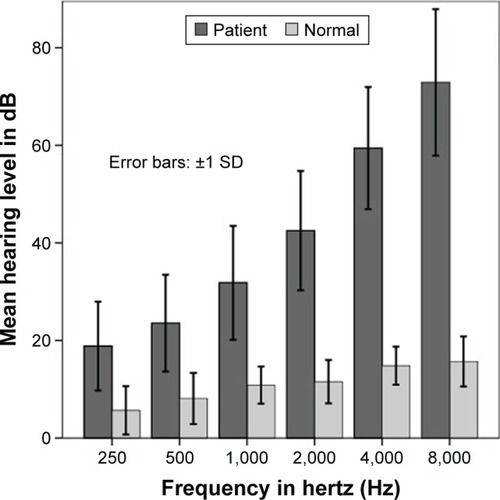
Table 1 Sequences of the PCR primers for BAK1, BCL2, and ACTB
Figure 2 Gene expression of BAK1 in peripheral blood samples from Iranian patients with ARHI and healthy subjects.
Notes: The difference between the two groups is statistically significant (U=484, P=0.008). The box plots show the median (solid line across the box).
Abbreviation: ARHI, age-related hearing impairment.
Abbreviation: ARHI, age-related hearing impairment.
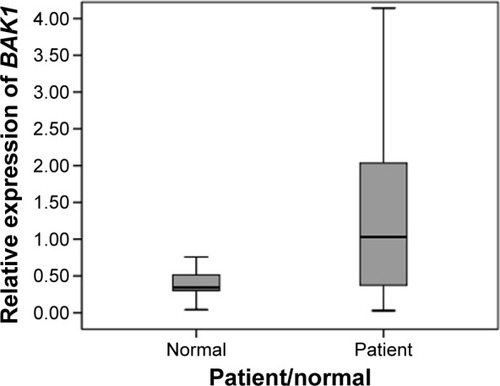
Figure 3 Gene expression of BCL2 in peripheral blood samples from Iranian patients with ARHI and healthy subjects.
Notes: Difference between the two groups is statistically significant (U=548, P=0.04).
Abbreviation: ARHI, age-related hearing impairment.
Abbreviation: ARHI, age-related hearing impairment.
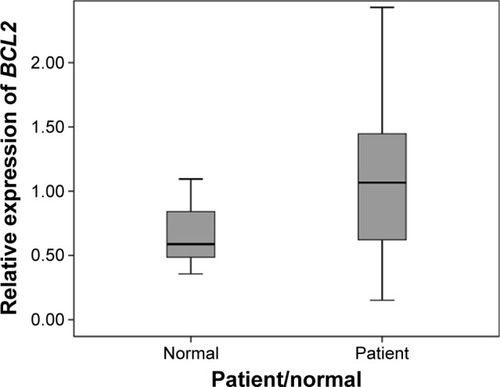
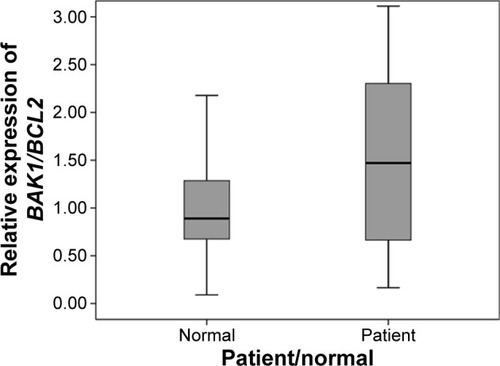
Figure 4 The BAK1/BCL2 gene expression ratios of Iranian patients with ARHI and healthy subjects. The difference between the two groups is statistically significant (U=544, P=0.039).
Abbreviation: ARHI, age-related hearing impairment.