Figures & data
Table 1 Association of PHQ-9 follow-up status with demographics and comorbid conditions
Table 2 Association of baseline PHQ-9 score with demographics and comorbid conditions (N=773)
Table 3 Mixed model results for PHQ-9 change over time
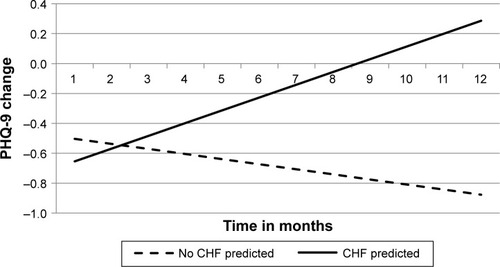
Figure 1 Predicted PHQ-9 change* from mixed effects model for baseline PHQ-9 (10+).
Note:
*Increase change score = decrease in PHQ-9 (improving symptoms).
Abbreviation: PHQ-9, patient health questionnaire-9.
Abbreviation: PHQ-9, patient health questionnaire-9.
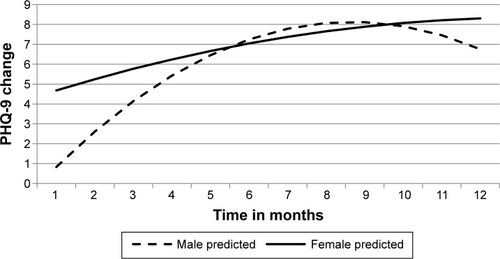
Figure 2 Predicted PHQ-9 change from mixed effects model for baseline PHQ-9 (5–9).
Abbreviations: PHQ-9, patient health questionnaire-9; CHF, congestive heart failure.
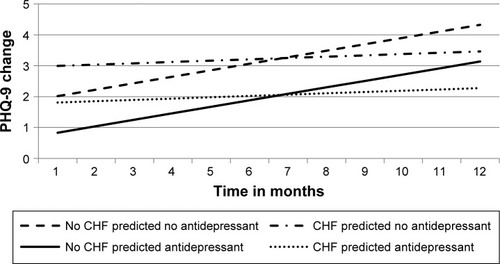
Figure 3 Predicted PHQ-9 change from mixed effects model for baseline PHQ-9 (0–4).
Abbreviations: PHQ-9, patient health questionnaire-9; CHF, congestive heart failure.