
Figures & data
Table 1 Characteristics, CBC, and LFT in 27 elderly subjects
Table 2 Oxidative stress, vitamins, and lipid profiles of all 27 volunteers
Figure 1 TAC (mmol Trolox/L) of all 27 elderly subjects during the control period (at week 0 and week 2) and after star fruit juice consumption for 4 weeks (at week 6).
Notes: Each bar represents the mean and standard deviation. Repeated measures ANOVA and Bonferroni post hoc tests were used for statistical analysis.
Abbreviations: ANOVA, analysis of variance; TAC, total antioxidant capacity.
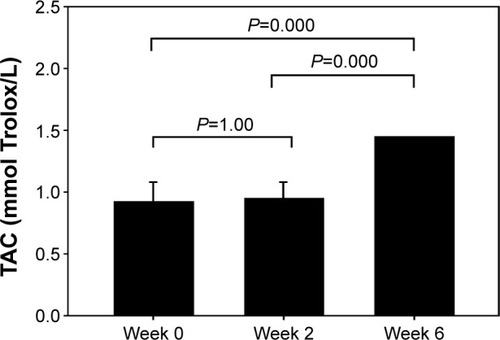
Figure 2 GSH (mg/g Hb) of all 27 elderly subjects during the control period (at week 0 and week 2) and after star fruit juice consumption for 4 weeks (at week 6).
Notes: Each bar represents the mean and standard deviation. Repeated measures ANOVA and Bonferroni post hoc tests were used for statistical analysis.
Abbreviations: ANOVA, analysis of variance; GSH, glutathione; Hb, hemoglobin.
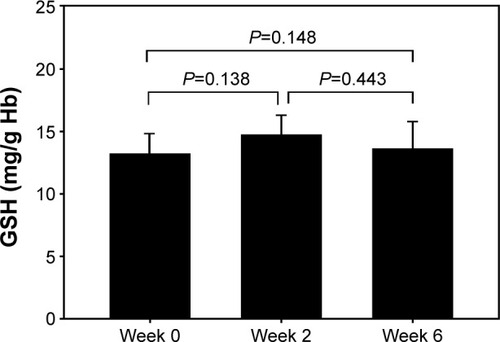
Figure 3 MDA (µmol/L) of all 27 elderly subjects during the control period (at week 0 and week 2) and after star fruit juice consumption for 4 weeks (at week 6).
Notes: Each bar represents the mean and standard deviation. Repeated measures ANOVA and Bonferroni post hoc tests were used for statistical analysis.
Abbreviations: ANOVA, analysis of variance; MDA, malondialdehyde.
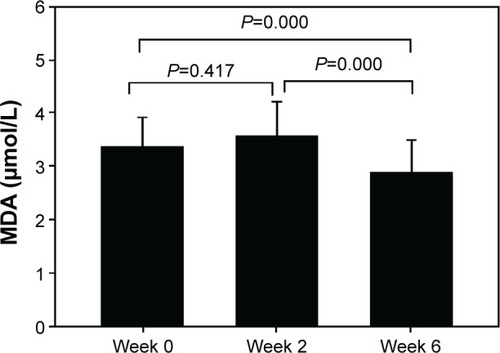
Figure 4 PrOOH (µmol/L) of all 27 elderly subjects during the control period (at week 0 and week 2) and after star fruit juice consumption for 4 weeks (at week 6).
Abbreviations: ANOVA, analysis of variance; PrOOH, protein hydroperoxide.
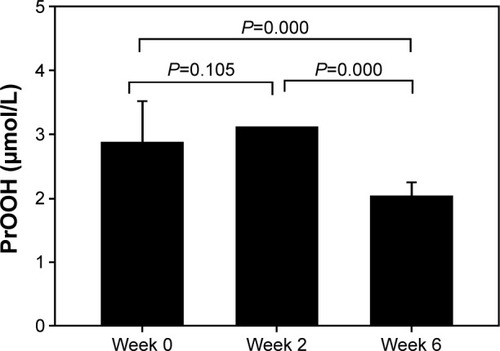
Figure 5 Vit C (mg/dL) of all 27 elderly subjects during the control period (at week 0 and week 2) and after star fruit juice consumption for 4 weeks (at week 6).
Notes: Each bar represents the mean and standard deviation. Repeated measures ANOVA and Bonferroni post hoc tests were used for statistical analysis.
Abbreviations: ANOVA, analysis of variance; Vit, vitamin.
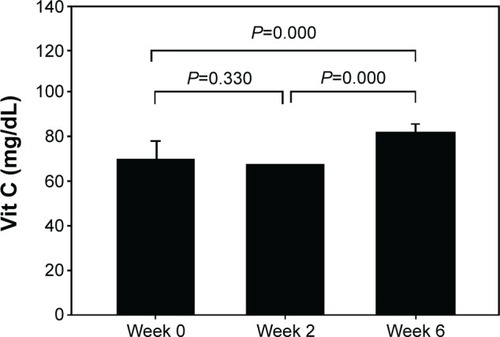
Figure 6 Vit A (µg/mL) of all 27 elderly subjects during the control period (at week 0 and week 2) and after star fruit juice consumption for 4 weeks (at week 6).
Notes: Each bar represents the mean and standard deviation. Repeated measures ANOVA and Bonferroni post hoc tests were used for statistical analysis.
Abbreviations: ANOVA, analysis of variance; Vit, vitamin.
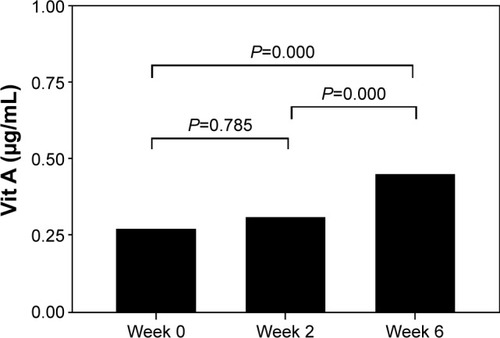
Figure 7 Vit E (µg/mL) levels of all 27 elderly subjects during the control period (at week 0 and week 2) and after star fruit juice consumption for 4 weeks (at week 6).
Abbreviations: ANOVA, analysis of variance; Vit, vitamin.
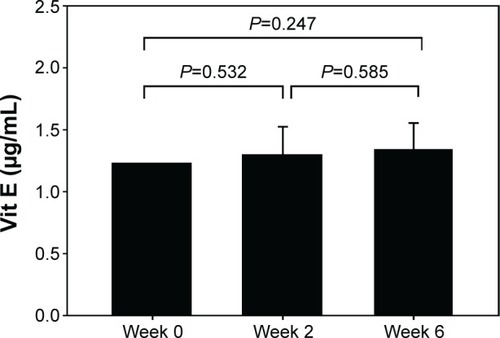
Table 3 Vitamin C and vitamin A in star fruit extracts (100 g) of each week