
Figures & data
Figure 1 Neuroimaging data.
Notes: T2-Fluid attenuated inversion recover images of brain magnetic resonance images taken 2 years after the symptom onset demonstrate diffuse cortical atrophy, more severe in the bilateral parietal lobes (A–D). 18F-Fluorodeoxyglucose positron emission tomography demonstrates a marked hypometabolism in the bilateral temporoparietal areas (E–H). A follow-up computed tomography taken 6 years after the onset showed a marked atrophy in whole brain (I–L).
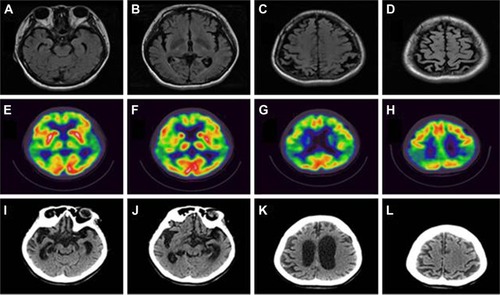
Figure 2 Data of genetic analysis for the AD patient with PSEN1 L226F.
Notes: (A) SSCP data of patient with L226F mutation, located at position 2 (2*). Numbers 1, 3, and 4 are wild-type samples (B). Sequencing data of PSEN1 L226F. (C) Location of L226F in PSEN1 protein.
Abbreviations: SSCP, single strand conformation polymorphism; AD, Alzheimer’s disease.
Abbreviations: SSCP, single strand conformation polymorphism; AD, Alzheimer’s disease.
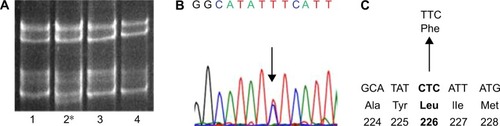
Figure 3 3D structure prediction for PSEX1 protein with L226F mutation, comparing to the normal PSEN1 protein.
Abbreviation: 3D, three dimensional.
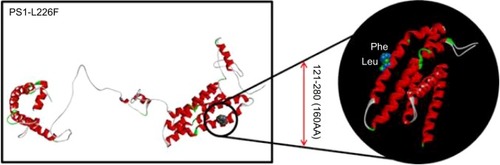
Table 1 Comparisons of dominant features of patients with PSEN1 L226F
Table 2 Comparisons of the distinct characteristics between the patients with PSEN1, L226F, and L226R
Table 3 Comparisons of PSEN1 mutations, which could be associated with FTD-like phenotypes