
Figures & data
Figure 1 Subjects’ recruitment flowchart.
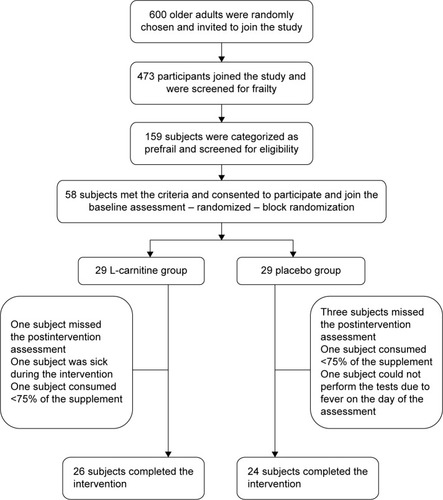
Table 1 Sociodemographic characteristics of the L-carnitine and placebo groups
Table 2 Effects of the intervention on the primary outcome variables for the L-carnitine and placebo groups (presented as mean ± SD)
Figure 2 Percent change in Frailty Index score and physical function.
Notes: (A) Frailty Index, (B) Hand grip, (C) PEFR *P<0.05, **P<0.01, using independent t-test/Mann–Whitney test.
Abbreviation: PEFR, peak expiratory flow rate.
Abbreviation: PEFR, peak expiratory flow rate.
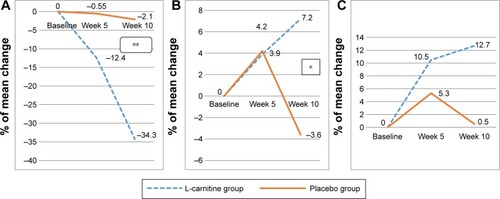
Figure 3 Percent of mean change in frailty in selected biomarkers.
Notes: (A) IL-6, (B) TNF-α, (C) IGF-1, no significant differences were found using independent t-test/Mann–Whitney test.
Abbreviations: IL-6, interleukin 6; IGF-1, insulin-like growth factor-1; TNF-α, tumor necrosis factor-alpha.
Abbreviations: IL-6, interleukin 6; IGF-1, insulin-like growth factor-1; TNF-α, tumor necrosis factor-alpha.
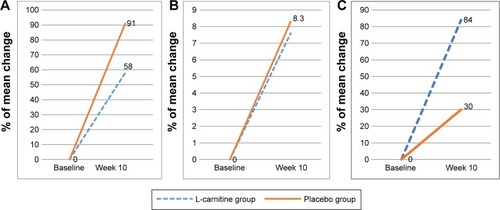
Figure 4 Changes in the frailty scores according to Fried criteria.
Notes: (A) L-carnitine group, (B) Placebo group.
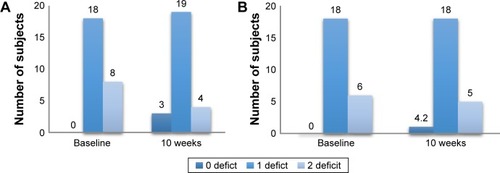
Figure 5 Changes in the frailty deficit percentage before and after the intervention.
Notes: (A) L-carnitine group, (B) placebo group.
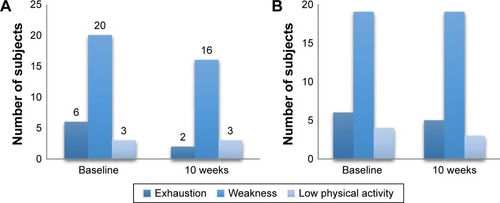
Table 3 Self-reported side effect by subjects (presented as n [%])