Figures & data
Figure 1 Consort study flow diagram.
Abbreviations: IPSS, International Prostate Symptom Score; TURP, transurethral resection of the prostate; TAM, tamsulosin hydrochloride 0.2 mg; SOL, solifenacin succinate 5 mg; wk, week.
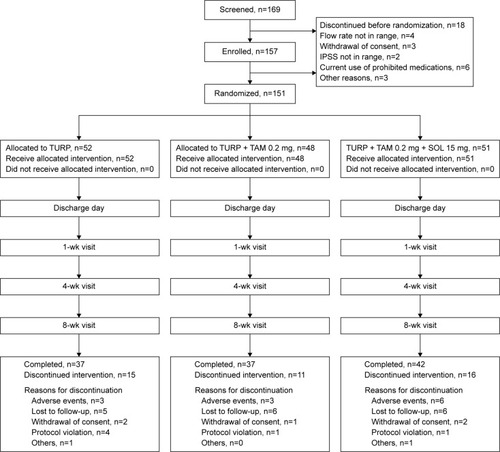
Table 1 Demographic and other baseline characteristics
Table 2 Mean change from baseline to the end of treatment
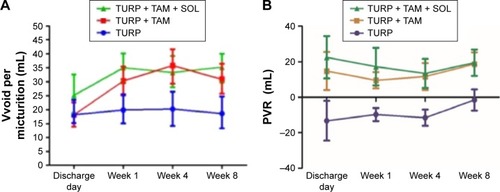
Figure 2 Mean change from baseline in Vvoid per micturition (A), and PVR (B) before surgery and at the 1-month and 2-month visits after surgery.
Abbreviations: Vvoid, volume voided; PVR, postvoid residual volume; TURP, transurethral resection of the prostate; TAM, tamsulosin hydrochloride 0.2 mg; SOL, solifenacin succinate 5 mg.