Figures & data
Figure 1 Flow diagram of attendance to the assessment sessions.
Abbreviations: CRS, calf-raise senior; FF, functional fitness.
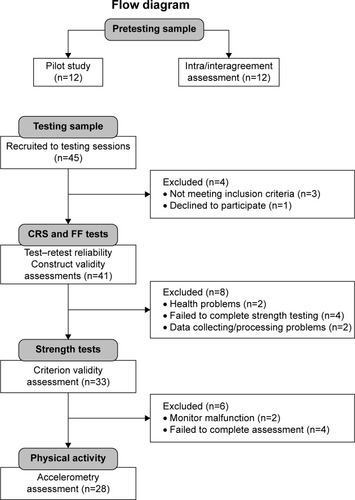
Figure 2 Protocol description of the calf-raise senior test.
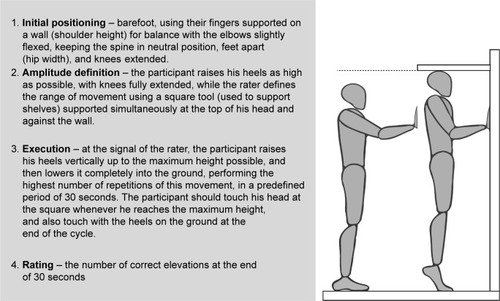
Figure 3 Plantar flexor strength test protocol in the BiodexSystem III machine.
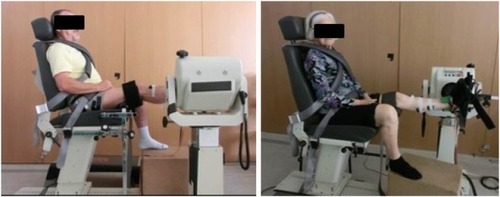
Table 1 Sample characterization: demographic, anthropometric, health, functional fitness, and strength parameters
Table 2 Results of intra- and interrater agreement analysis of CRS test
Table 3 Comparison among groups of age, PA, FF, and sex and CRS scores
Table 4 Correlations between strength measures and CRS scores
Figure 4 Linear regression analysis among strength measures (MISM torque, MISK torque, and RFD) and CRS test scores.
Abbreviations: CRS, calf-raise senior; MISK, maximal isokinetic; MISM, maximal isometric; reps, repetitions; RFD, rate of force development.
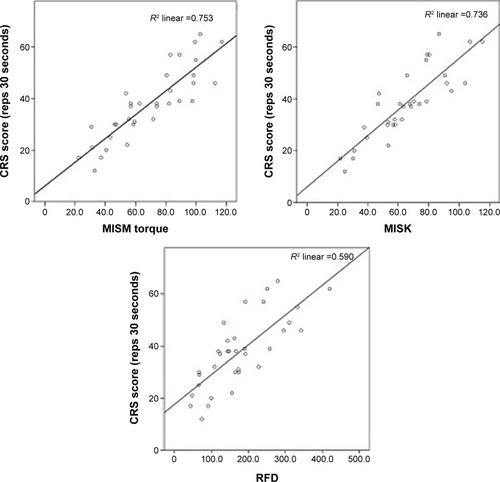
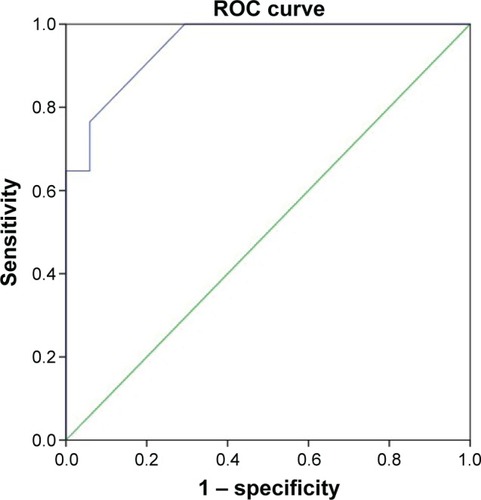
Figure 5 ROC curves between CRS scores of subjects presenting best and worst results in isometric tests.
Abbreviations: ROC, receiver-operating characteristics; CRS, calf-raise senior.