Figures & data
Table 1 Components of the fall prevention program implemented in the Department of Geriatrics at University Hospital Number 7 SUM, Katowice, Poland
Table 2 Demographic, clinical, and functional differences between patients who experienced falls during hospitalization (group F) as compared with patients who did not (group C)
Table 3 Variables that yield P-values of 0.1 or lower in the initial univariate logistic regression analysis of factors predictive of falls
Figure 1 Fall probability of geriatric inpatients who experienced a fall incident during hospitalization in relation to hospitalization day.
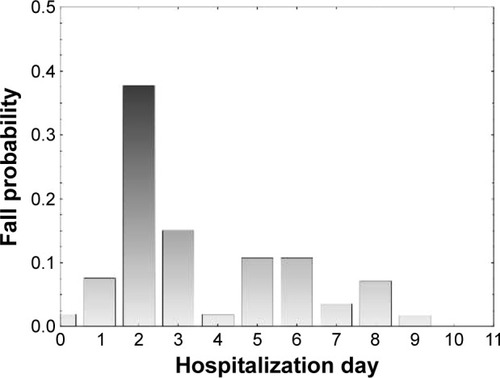
Figure 2 Fall probability of geriatric inpatients who experienced a fall incident during hospitalization in relation to the time of day.
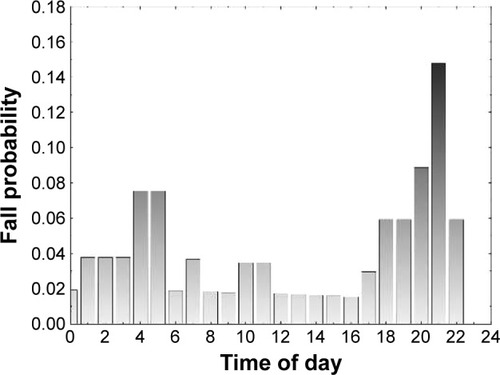
Figure 3 Probability of fall-free hospitalization according to (A) age <76 years compared to older age, (B) BMI ≥23.5 compared to lower values, (C) MMSE scores ≥20 compared to lower values, and (D) Barthel Index of Activities of Daily Living (BI) ≥65 compared to lower values.
Abbreviations: BMI, body mass index; MMSE, Mini-Mental State Examination.
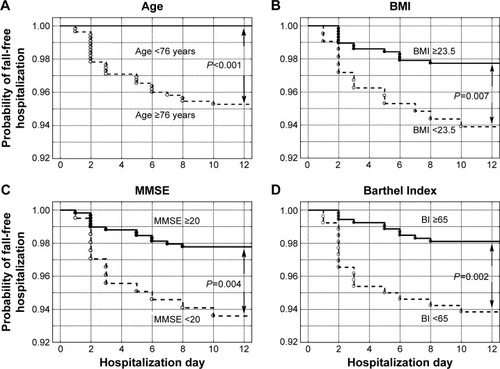
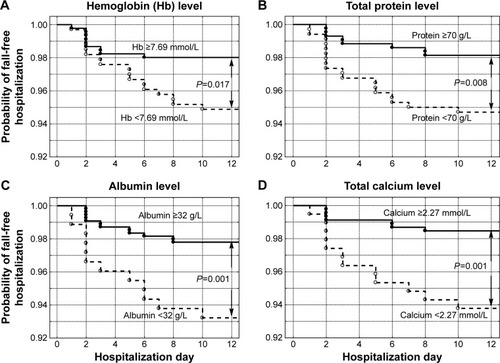
Figure 4 Probability of fall-free hospitalization according to (A) hemoglobin level ≥7.69 mmol/L compared to lower values, (B) serum total protein level ≥70 g/L compared to lower values, (C) serum albumin level ≥32 g/L compared to lower values, and (D) serum total calcium level ≥2.27 mmol/L compared to lower values.