Figures & data
Figure 1 Photograph taken during T3 anodal transcranial direct current stimulation (tDCS) in a representative subject.
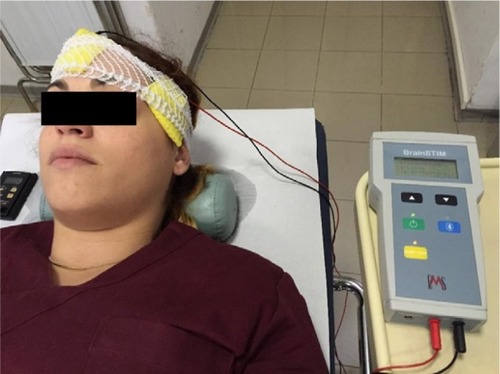
Figure 2 An example of a 15-minute recording during sham or real anodal transcranial direct current stimulation (tDCS).
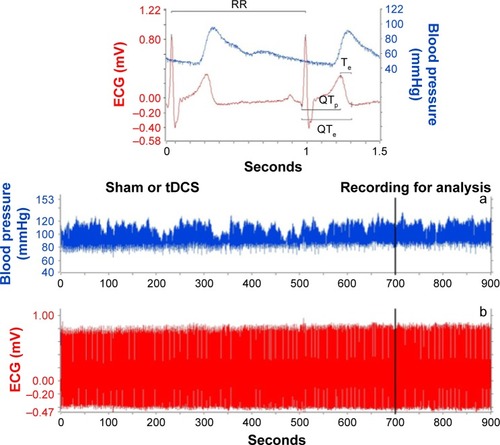
Figure 3 Example of a 5-minute ECG recording: RR, QTe (from the Q wave to the T wave end), QTp (from the Q wave to the T wave peak), and Te (difference between QTe and QTp) intervals and relative variability indexes: SDNN, QTeVI, QTpVI, and TeVI.
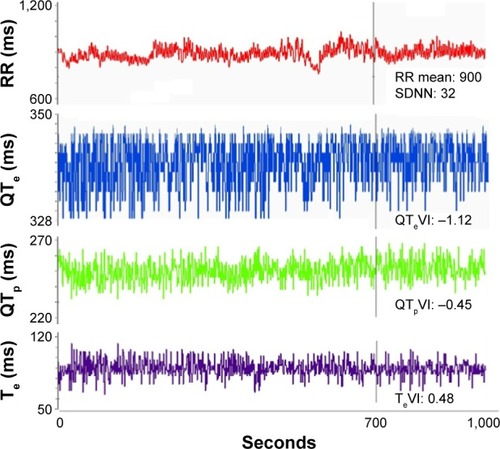
Figure 4 (A) shows the spectrum for SBP, (B) shows the R–R variability spectrum, and (C) shows the index during sham (left panel) or active tDCS (right panel).
Abbreviations: SBP, systolic blood pressure; tDCS, transcranial direct current stimulation; LF, low frequency; HF, high frequency; TP, total power; VLF, very low-frequency; NU, normalized units; PSD, power spectral density.
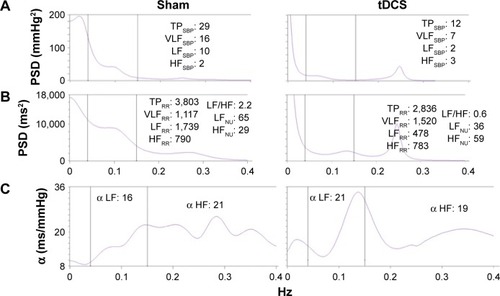
Table 1 Characteristics of the healthy elderly volunteers who underwent transcranial direct current stimulation
Table 2 RR, QTe, QTp, and Te interval data in the healthy elderly volunteers who underwent sham and active tDCS
Table 3 Power spectral analysis of RR and SBP data in the healthy elderly volunteers who underwent sham and active tDCS
Figure 5 QTeVI during sham or anodal tDCS in volunteers younger and older than 60 years.
Abbreviations: QTeVI, QTe variability index; tDCS, transcranial direct current stimulation; ns, nonsignificant.
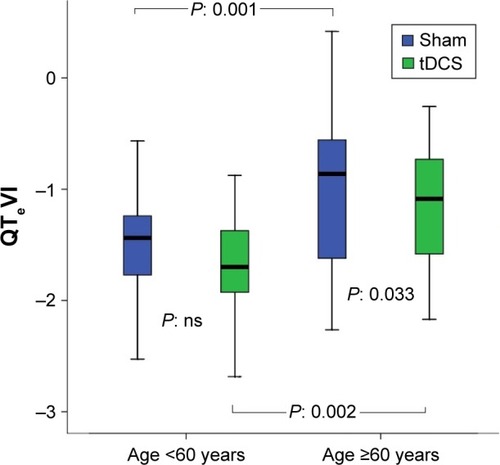
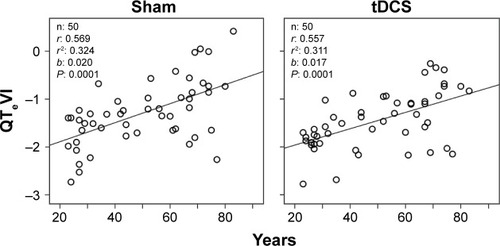
Figure 6 Relationship between QTe variability index (QTeVI) and age in healthy control subjects during sham or active transcranial direct current stimulation (tDCS).