
Figures & data
Figure 1 Participant flow through the different study phases.
Abbreviations: FU, follow-up; SMI, skeletal muscle index; WB-EMS, whole-body electromyostimulation; WB-EMS&P, whole-body electromyostimulation and protein supplementation.
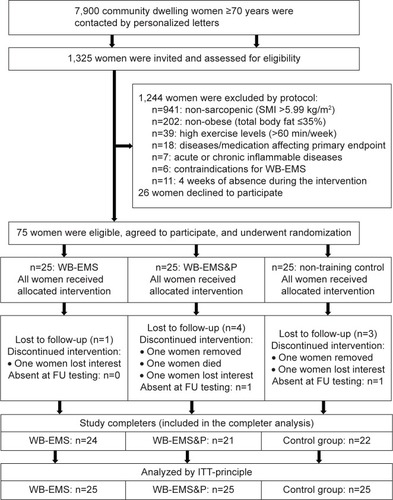
Table 1 Baseline characteristics of the three study groups
Figure 2 WB-EMS application with slight movements in a supine sitting/lying position.
Abbreviation: WB-EMS, whole-body electromyostimulation.
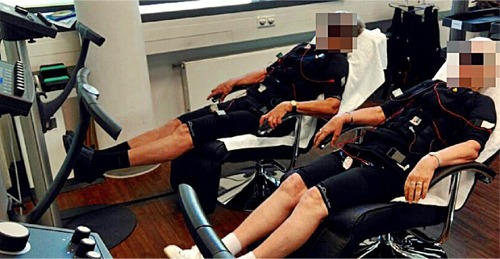
Table 2 Baseline values and changes of metabolic syndrome parameters in the three study groups
Table 3 Baseline values and changes of selected parameters constituting the metabolic syndrome Z-score according to the NCEP ATP III criteriaCitation17