Figures & data
Table 1 Demographics and clinical measurements of MB and HC groups
Table 2 Brain areas with significantly different ALFF values between groups
Figure 1 Spontaneous brain activity in the monocular blindness and healthy control groups.
Notes: Significant brain activity differences were observed in the left cerebellum anterior lobe, right parahippocampal gyrus, right cuneus, left precentral gyrus, left paracentral lobule, right middle frontal gyrus, left middle frontal gyrus and left supramarginal gyrus. The red or yellow denotes higher ALFF values, and the blue areas indicate lower ALFF values, respectively (P<0.01 for multiple comparisons using Gaussian random field theory [z>2.3, P<0.01, cluster >40 voxels, AlphaSim corrected]).
Abbreviations: ALFF, amplitude of low-frequency fluctuation; L, left; R, right.
![Figure 1 Spontaneous brain activity in the monocular blindness and healthy control groups.Notes: Significant brain activity differences were observed in the left cerebellum anterior lobe, right parahippocampal gyrus, right cuneus, left precentral gyrus, left paracentral lobule, right middle frontal gyrus, left middle frontal gyrus and left supramarginal gyrus. The red or yellow denotes higher ALFF values, and the blue areas indicate lower ALFF values, respectively (P<0.01 for multiple comparisons using Gaussian random field theory [z>2.3, P<0.01, cluster >40 voxels, AlphaSim corrected]).Abbreviations: ALFF, amplitude of low-frequency fluctuation; L, left; R, right.](/cms/asset/5b548b82-bbd0-4d66-834f-20b64909e83a/dcia_a_117292_f0001_c.jpg)
Figure 2 The mean values of altered ALFF values between the MB and HC groups.

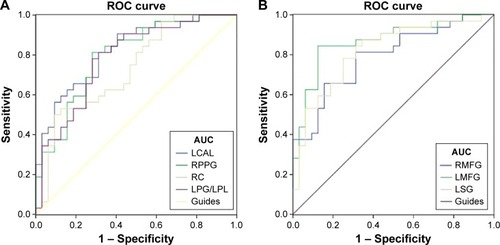
Figure 3 ROC curve analysis of the mean ALFF values for altered brain regions.
Abbreviations: ROC, receiver operating characteristic; ALFF, amplitude of low-frequency fluctuation; CI, confidence interval; HCs, healthy controls; LCAL, left cerebellum anterior lobe; RPPG, right parahippocampal gyrus; RC, right cuneus; LPG, left precentral gyrus; LPL, left paracentral lobule; RMFG, right middle frontal gyrus; LMFG, left middle frontal gyrus; LSG, left supramarginal gyrus; AUC, area under the curve.