
Figures & data
Table 1 Composition of the experimental drink
Table 2 Physical characteristics of subjects
Figure 1 Changes in cfPWV (A) and faPWV (B) before and after cocoa intake.
Note: *P<0.05 vs before.
Abbreviations: cfPWV, carotid–femoral pulse-wave velocity; faPWV, femoral–ankle pulse-wave velocity.
Abbreviations: cfPWV, carotid–femoral pulse-wave velocity; faPWV, femoral–ankle pulse-wave velocity.
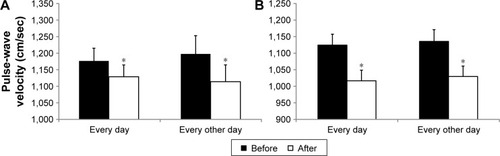
Table 3 Cardiovascular indices
Figure 2 Changes in plasma ET1 concentrations before and after cocoa intake.
Note: *P<0.05 vs before.
Abbreviation: ET1, endothelin 1.
Abbreviation: ET1, endothelin 1.
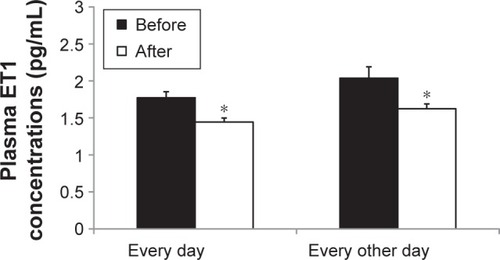
Table 4 Cardiovascular risk factors