
Figures & data
Figure 1 CONSORT diagram of recruitment and randomization process.
Abbreviations: RT2, resistance training group completing two training sessions/week; RT3, resistance training group completing three training sessions/week.
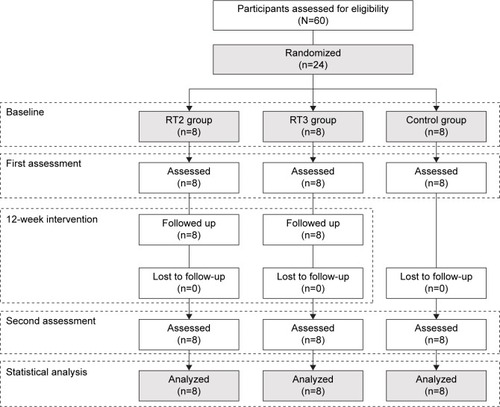
Table 1 Cohort characteristic at baseline of the intervention group
Table 2 Training effects (with 90% confidence limits) for the strength, power-related, and functional performance variables
Table 3 Training effects (with 90% confidence limits) for the balance performance variables
Table 4 Training effects (with 90% confidence limits) for the responses to the menopause-specific quality of life questionnaire