Figures & data
Table 1 Baseline characteristics
Figure 1 The study CONSORT flow diagram.
Abbreviation: CONSORT, Consolidated Standards of Reporting Trials.
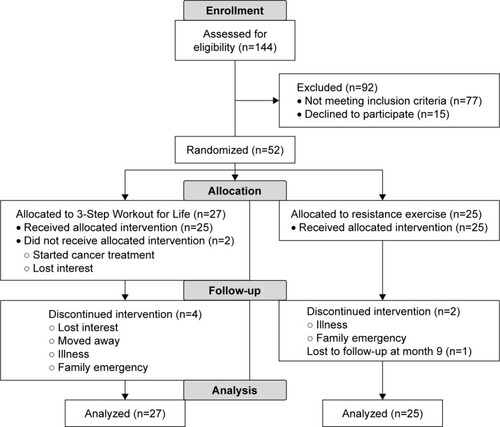
Table 2 Comparing mean change from baseline to postintervention and 6-month follow-up
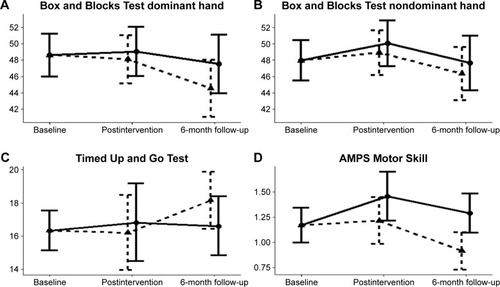
Figure 2 Estimated means and 95% confidence intervals by outcomes and groups at postintervention and 6-month follow-up.
Notes: Outcome of the Box and Blocks Test dominant hand by groups and time points (A). Outcome of the Box and Blocks Test non-dominant hand by groups and time points (B). Outcome of the Timed Up and Go Test by groups and time points (C). Outcome of the AMPS Motor Skills by groups and time points (D). Solid line: 3-Step Workout for Life Group. Dashed line: Resistance Exercise Only Group. Estimates were based on the constrained longitudinal data analysis.
Abbreviation: AMPS, Assessment of Motor and Process Skills.
Abbreviation: AMPS, Assessment of Motor and Process Skills.