
Figures & data
Figure 1 Diagram of participant flow through the different study phases.
Abbreviations: EMS, electromyostimulation; FU, follow-up; ITT, intention to treat; WB-EMS&P, whole-body EMS and protein supplementation.
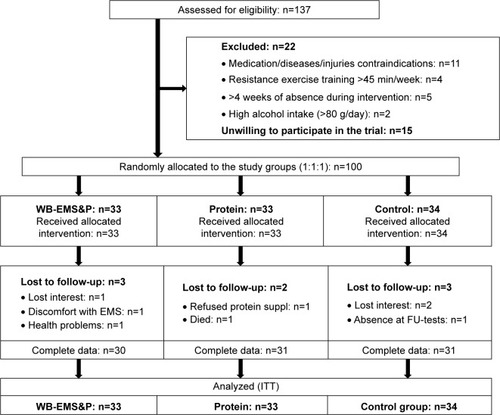
Figure 2 WB-EMS equipment with operator device and electrodes (vest, arm-, leg-, gluteal-cuffs).
Abbreviation: WB-EMS, whole-body electromyostimulation.
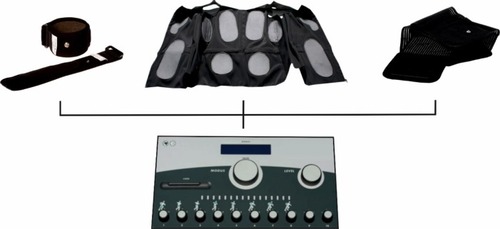
Table 1 Baseline characteristics of the FranSO study
Table 2 Baseline values and changes of the Sarcopenia Z-Score according to FNIH in the study groups
Table 3 Baseline values and changes of secondary study outcomes in the study groups