Figures & data
Table 1 Affinity and selectivity for human α1-AR subtype for silodosin and other α1-AR antagonists
Table 2 pA2 or pKb values of silodosin and other α1-AR antagonists for noradrenaline-induced contraction in the isolated rabbit prostate, urethra and bladder, and in the isolated rat spleen and thoracic aorta
Table 3 ID50 value, ED15 value and uroselectivity of silodosin and other α1-AR antagonists after intravenous administration in the anesthetized rat
Table 4 Results of pivotal Phase III clinical trials
Figure 1 Time course of change in International Prostate Symptom Score in randomized, placebo-controlled, double-blind Phase III study.
Copyright © 2006, John Wiley and Sons. Reproduced with permissions from Kawabe et al.Citation27
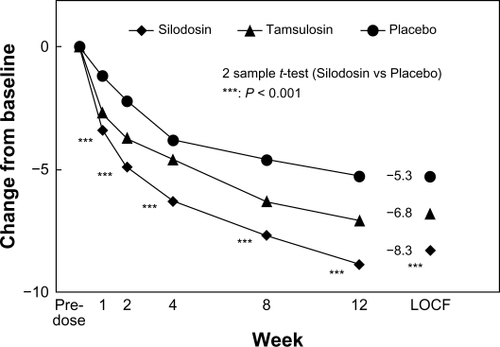
Table 5 Adverse effects of silodosin compared with tamsulosin and placebo