Figures & data
Table 1 Demographic characteristics at baseline (n = 262)
Table 2 GBS (Gottfries-Bråne-Steen) subscales mean scores and mean differences at baseline and follow-ups (n = 262)
Table 3 Mean scores at baseline and mean differences at follow-ups for surviving patients at 18 months (Intervention [I] n = 76, Control [C] n = 68)
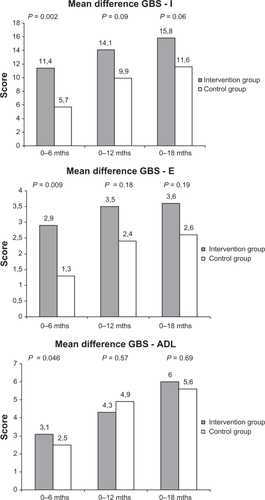
Figure 1 Mean differences of the ratings in the GBS-I, GBS-E, and GBS-ADL subscales by the family caregivers in the intervention group and control group, between baseline and 6, 12 and 18 months respectively for the survivors.
Abbreviations: GBS-I, Gottfries-Bråne-Steen scale-intellectual; GBS-E, Gottfries-Bråne-Steen scale-emotional; GBS-ADL, Gottfries-Bråne-Steen scale-activity of daily living; mths, months.