Figures & data
Table 1 Characteristics of the selected studies
Figure 1 Flow diagram of the article selection process.
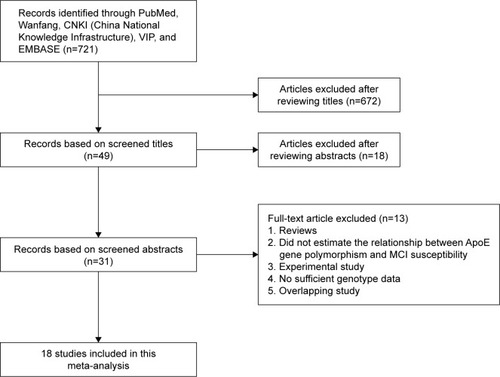
Table 2 Meta-analysis of apolipoprotein E gene polymorphism and MCI risk
Figure 2 Forest plot for the association of ApoE polymorphism with MCI susceptibility in the overall populations (ε4 vs ε3).
Abbreviations: ApoE, apolipoprotein E; MCI, mild cognitive impairment; OR, odds ratio; CI, confidence interval.
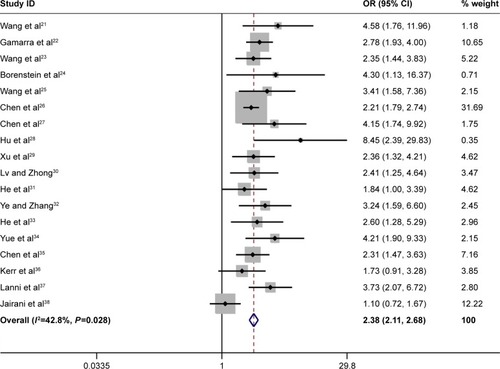
Figure 3 Forest plot for the association of ApoE polymorphism with MCI susceptibility in the overall populations (ε2 vs ε3).
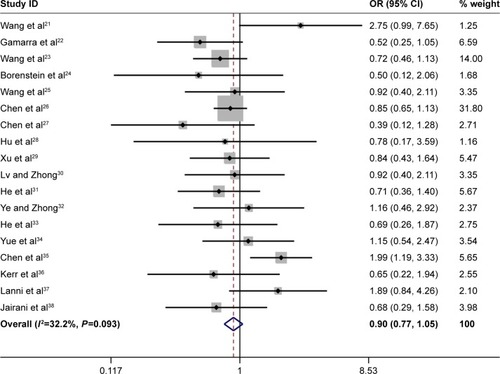
Figure 4 Sensitivity analysis of the summary of OR coefficients in the overall populations (ε4 vs ε3).
Abbreviations: OR, odds ratio; CI, confidence interval.
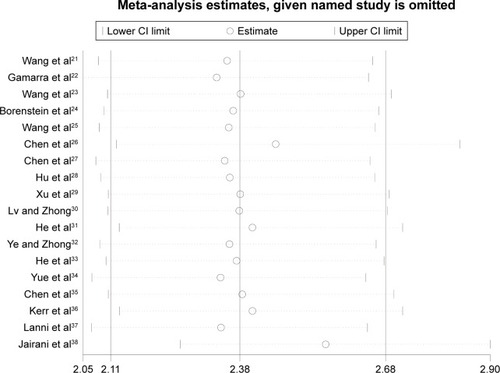
Figure 5 Sensitivity analysis of the summary of OR coefficients in the overall populations (ε2 vs ε3).
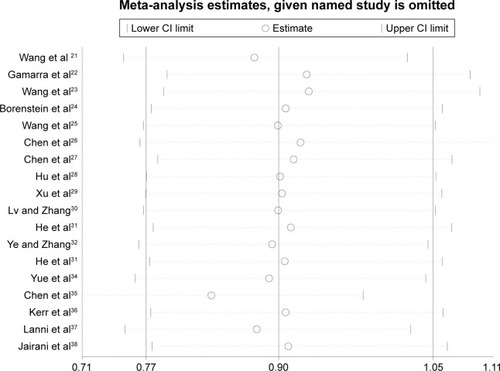
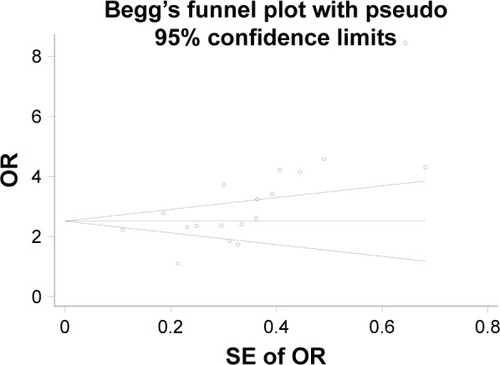
Figure 6 Begg’s funnel plot of ApoE polymorphism with MCI susceptibility in overall populations (ε2 vs ε3).
Abbreviations: ApoE, apolipoprotein E; MCI, mild cognitive impairment; OR, odds ratio; SE, standard error.
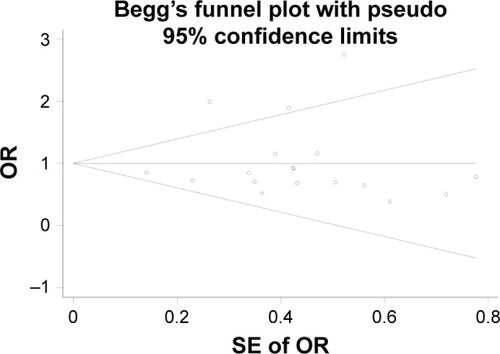
Figure 7 Begg’s funnel plot of ApoE polymorphism with MCI susceptibility in overall populations (ε4 vs ε3).