
Figures & data
Table 1 Descriptive characteristics of the study participants
Figure 1 Percentages of individuals in the functional categories (maximum assistance to minimum to no assistance) at admission and discharge among (A) adults and (B) older adults.
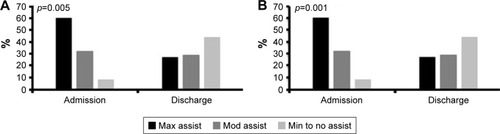
Table 2 Regression analysis of the total FIM scores of older adults with stroke after discharge from an inpatient rehabilitation unit
Table 3 Regression analysis of the motor FIM scores of older adults with stroke after discharge from an inpatient rehabilitation unit
Table 4 Regression analysis of the cognitive FIM scores of older adults with stroke after discharge from an inpatient rehabilitation unit