Figures & data
Table 1 Clinical characteristics of case groups and controls
Table 2 Comparison of VDR-ApaI genotype and allele frequency between case groups and controls
Table 3 Comparison of VDR-TaqI genotype and allele frequency between case groups and controls
Table 4 Comparison of VDR-FokI genotype and allele frequency between case groups and controls
Table 5 Comparison of VDR-FokI genotype between cases and controls in dominant or recessive model
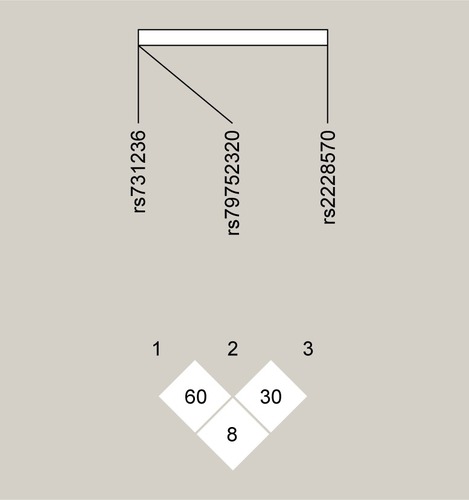
Figure 1 Pairwise linkage disequilibrium analysis of the three VDR gene SNPs: plot shows pairwise correlation of the SNPs (TaqI, ApaI and FokI) studied.
Abbreviations: VDR, vitamin D receptor; SNPs, single nucleotide polymorphisms.