
Figures & data
Figure 1 Paro® robot seal.
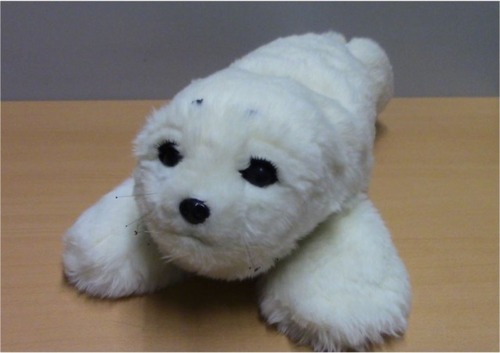
Figure 2 Protocol phases.
Abbreviations: I-PANAS SF, International Positive and Negative Affect Schedule Short-Form; MMSE, Mini Mental State Examination; NPI-ES, Neuropsychiatric Inventory for Health Staff.
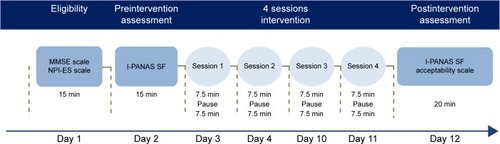
Table 1 Usability and perception measures of Paro® robot
Figure 3 Flowchart of the quasi-experimental pilot study.
Note: *After medical advice.
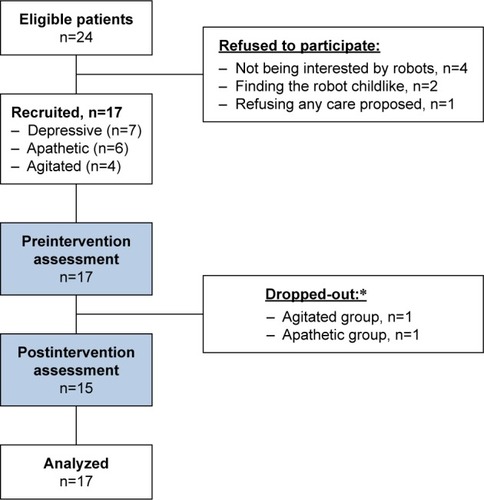
Table 2 Demographics, psychometrics, and clinical characteristics of participants
Figure 4 Overall affectivity scores pre- and postintervention.
Note: *Significant result (p<0.05).
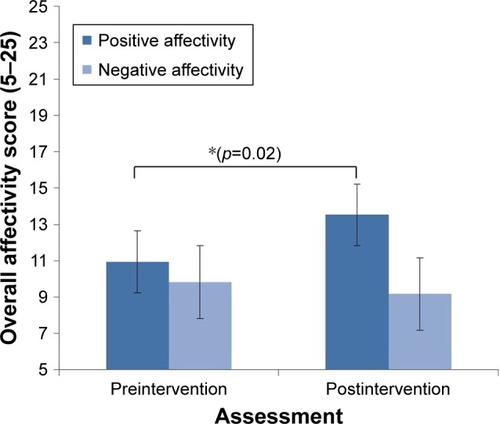
Table 3 Comparison of outcomes between groups
Table 4 Categories and examples of responses during Paro® exposition