
Figures & data
Table 1 The distribution of pain routine treatment in all studied subjects – patients were grouped based on the strongest analgesic type
Figure 1 Relationship between pain and behavioral disturbances, N=96.
Abbreviations: APS, Abbey Pain Scale; CMAI, Cohen–Mansfield Agitation Inventory Scale.
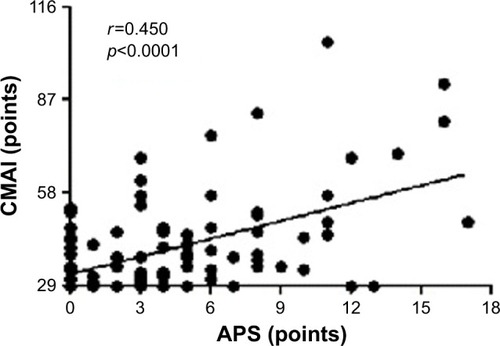
Table 2 The characteristics of studied subjects divided based on CMAI