
Figures & data
Table 1 Comparisons by community
Table 2 Baseline and endpoint comparisons by treatment
Table 3 Correlations among mLuxAVG and change in outcomes
Figure 1 CSDD change by community.
Note: Intraclass correlation of Cornell change (within-community correlation) =0.03.
Abbreviation: CSDD, Cornell Scale for Depression in Dementia.
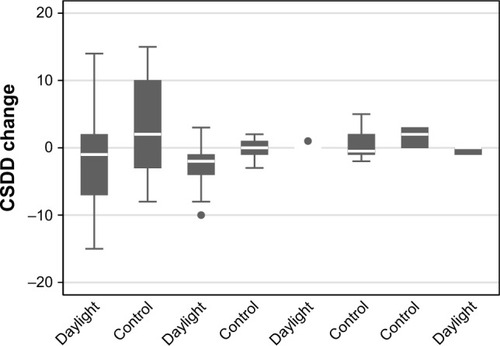
Figure 2 NPI-NH change by community.
Note: Intraclass correlation of NPI-NH change (within-community correlation) =0.065.
Abbreviation: NPI-NH, Neuropsychiatric Inventory Nursing Home Version.
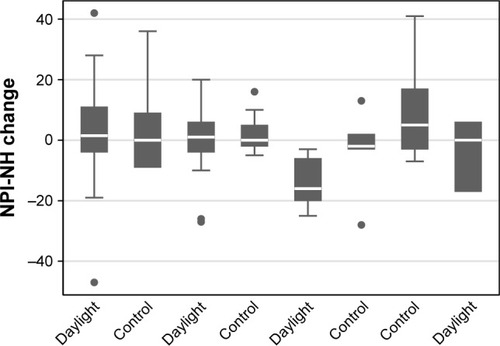
Figure 3 Scatter plot of changes in CSDD.
Abbreviations: CSDD, Cornell Scale for Depression in Dementia; mLuxAVG, average melanopic illuminance at 3 m from windows.
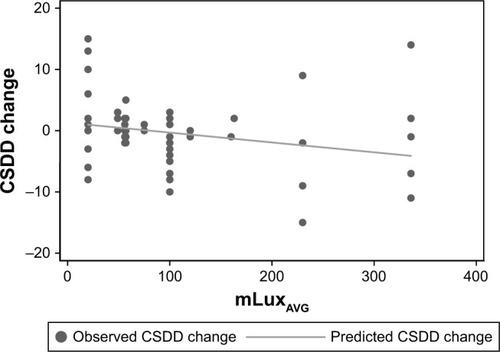
Table 4 Treatment group comparisons on behavioral and depression change: baseline Cornell >10