
Figures & data
Figure 1 X-ray imaging of the fracture healing process in mice with prednisone exposure.
Notes: GC-L: CD-1 mice exposed to prednisone (6 mg/kg/day); GC-M: CD-1 mice exposed to prednisone (9 mg/kg/day); GC-H: CD-1 mice exposed to prednisone (12 mg/kg/day). Control: wild-type CD-1 mice.
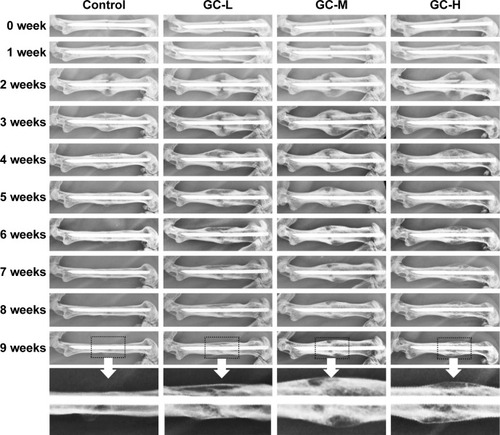
Figure 2 X-ray imaging analysis of fracture callus tissue post-fracture.
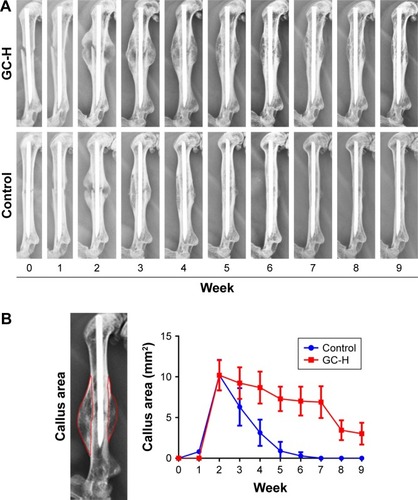
Table 1 Fracture callus quantified by histologic analysis at 2 weeks post-closed femur fracture
Table 2 Fracture callus quantified by micro-CT analysis at 2 weeks post-closed femur fracture
Figure 3 Representative histological images of fracture callus at 2 weeks post-closed femur fracture in mice.
Notes: GC-H: CD-1 mice exposed to prednisone (12 mg/kg/day); Control: wild-type CD-1 mice. Longitudinal sections of the calluses were subjected to Safranin O and H&E staining. Red color indicates the chondrocyte area in the callus. Chondrocyte area, total callus area and bone area in the callus were quantified with Image-Pro Plus 6.0 based on histological staining ().
Abbreviation: H&E, hematoxylin and eosin.
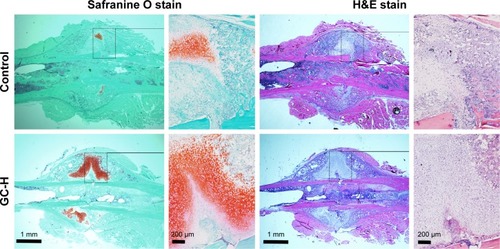
Figure 4 Micro-CT images of fractured femoral callus from representative specimens at 2 weeks post-fracture.
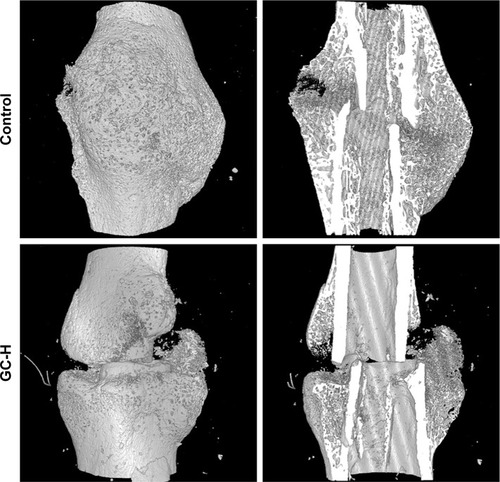
Figure 5 Micro-CT analysis of fractured femoral callus from representative specimens at 9 weeks post-fracture.
Abbreviations: BMD, bone mineral density; BV/TV, bone volume to tissue volume.
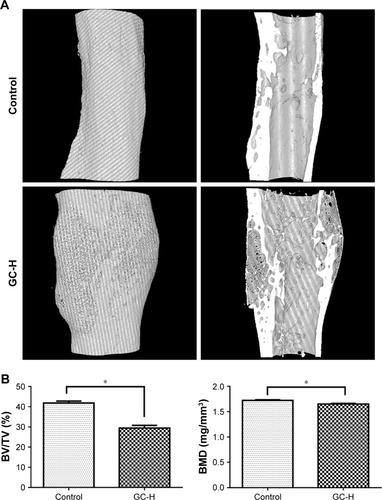
Table 3 Analysis of the biomechanical properties of the healed femur at 9 weeks post-femur fracture