Figures & data
Table 1 General characteristics of the transcatheter aortic valve replacement patients
Figure 1 Comparison between survivors and cardiovascular mortality cases regarding the significant ECG data, obtained baseline.
Abbreviations: ECG, electrocardiogram; ERS, electrical risk score; TAVR, transcatheter aortic valve replacement; V4, 4th precordial lead.
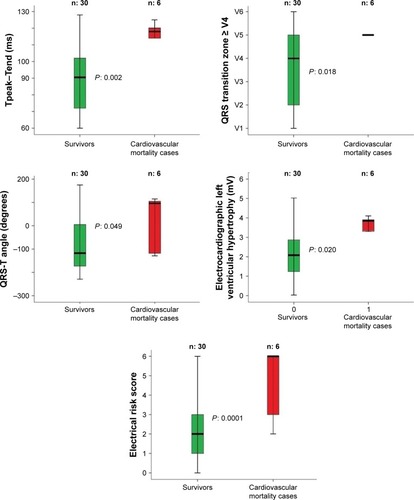
Table 2 Electrocardiographic measures in the transcatheter aortic valve replacement patients
Table 3 Electrocardiographic abnormal markers in the transcatheter aortic valve replacement patients
Figure 2 Comparison between survivors and total mortality cases regarding the significant ECG data, obtained baseline.
Notes: In particular, the survivor subjects after 1 year of TAVR follow-up showed a significant lower pre-TAVR: Tpeak–Tend segment, QRS transition zone, electrocardiogram left ventricular hypertrophy, and ERS. In the box plots, the central line represents the median distribution. Each box spans from 25 to 75th percentile points, and error bars extended from 10 to 90th percentile points.
Abbreviations: ECG, electrocardiogram; ERS, electrical risk score; TAVR, transcatheter aortic valve replacement.
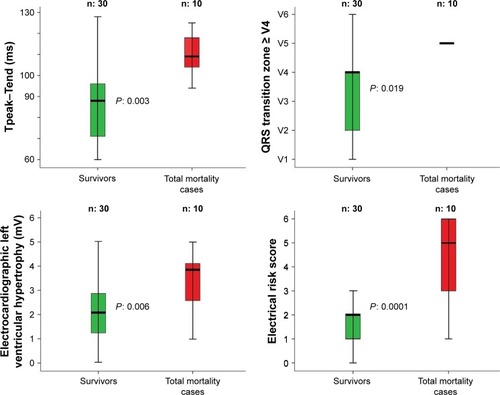
Figure 3 We reported the total (A) and cardiovascular (B) mortality in the subjects with less or equal or higher than four electrical risk score in the study subjects.
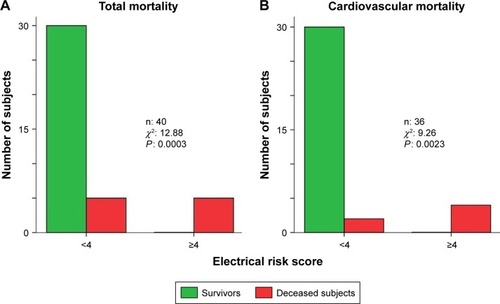
Figure 4 Receiver operating characteristic curve (ROC) analysis showing that the electrical risk score (ERS) was the best predictor of total (A) or cardiovascular (B) mortality in TAVR patients.
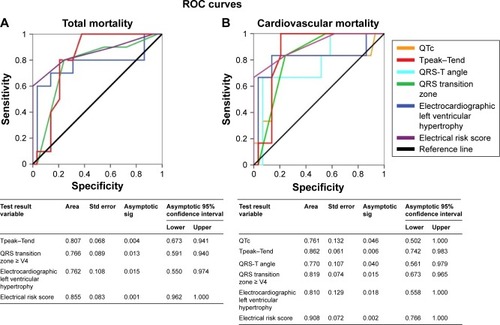
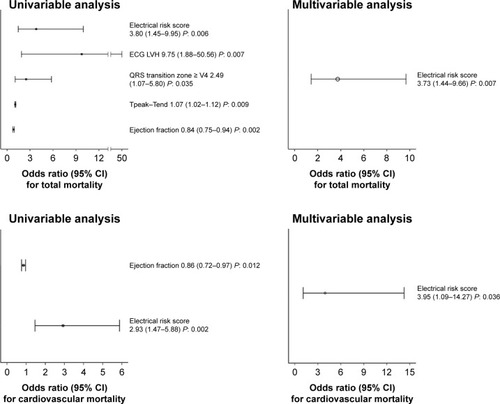
Figure 5 Odds ratio for electrical risk score, electrocardiographic left ventricular hypertrophy (ECG LVH), QRS transition zone > V4, Tpeak–Tend interval, ejection fraction in respect to total and cardiovascular mortality in uni- or multivariable analysis.