Figures & data
Table 1 (A) Participants’ health characteristics with stratification to frailty status by Fried phenotype model (exposure) and (B) participants’ frailty and disability characteristics with stratification to frailty status by Fried phenotype model (exposure)
Table 2 Spearman correlations coefficients of anthropometric and metabolic variables and functional tests
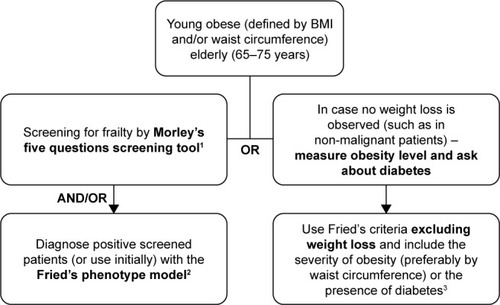
Figure 1 Sensitivity rates (%) of the different models per each cutoff to differentiate the frailty states.
Abbreviations: BMI, body mass index; FRAIL, fatigue, resistance, ambulation, illnesses, and loss of weight; WC, waist circumference.
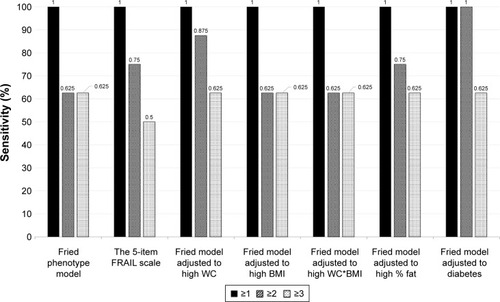
Table 3 Participants’ general and frailty characteristics with stratification to functional status by the comprehensive functional assessment questionnaire (outcome)
Figure 2 The adjusted correlation between frailty scores (by the three detective models) to function scores using linear regression.
Abbreviation: WC, waist circumference.
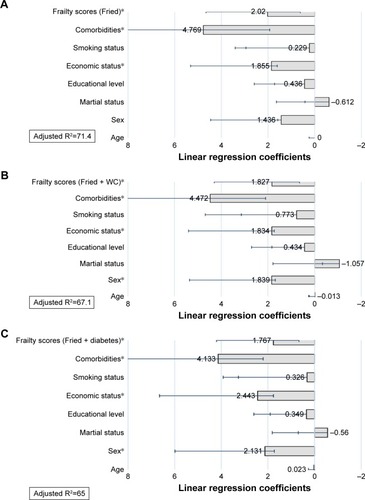
Figure 3 Optional screening and/or diagnosing flow for obese younger elderly subjects.
Abbreviations: WC, waist circumference; BMI, body mass index.