
Figures & data
Figure 1 Flowchart depicting the selection process of the included older persons.
Abbreviation: ICU, intensive care unit.
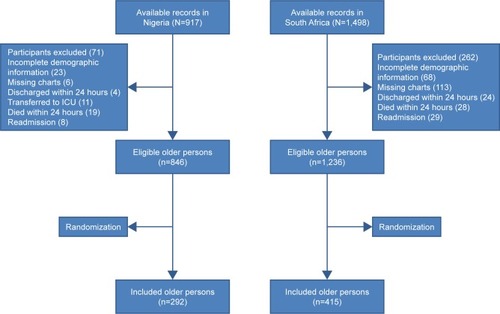
Table 1 Characteristics of the older persons investigated in the study
Table 2 The classification of PIM received by the older persons in Nigeria and South Africa
Table 3 The triggers for identifying suspected ADRs
Table 4 The ADRs and the offending medications among older persons
Table 5 The univariate and multivariate analysis of independent variables and ADRs in Nigeria and South Africa
Table S1 PIM utilization among participants in Nigeria and South Africa
Table S2 Potential inappropriate medicines that resulted in ADRs among study participants