Figures & data
Table 1 Demographic data of 146 participants
Table 2 The number (%) and 95% confidence interval of subjects who fell at baseline and 12-month after recruitment (cumulative frequency), analyzed by per protocol (PP) and intention-to-treat (ITT) methods
Table 3 Mean (SD) of the balancing abilities at baseline and 12-month follow up period compared between infrequent fall and frequent fall groups (N = 118)
Table 4 Compliance with exercise during 3-month, 6-month, 9-month and 12-month follow up period
Figure 1 Balancing abilities including timed up and go test, chair stand, functional reach, and Berg balance scale based on compliance with exercise.
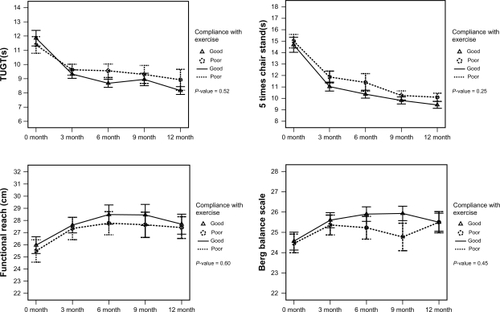
Figure 2 Quality of life score (SF-36) of 104 participants compared between baseline and 1-year after.
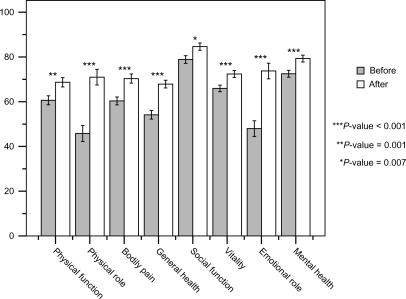
Table 5 Crude odds and adjusted odds of the factors relating to fall frequency (N = 104)