Figures & data
Table 1 Characteristics of participants by gender
Table 2 Characteristics of participants by hypertensive status
Table 3 Correlation coefficient (R) between the electrocardiographic and echocardiographic parameters for the detection of LVHin total participants, in both males and females
Table 4 Chi-squared test between LVH diagnosed by ECG and by ECHO
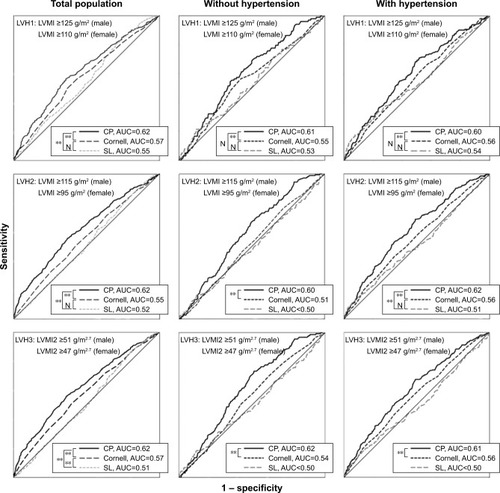
Figure 1 ROC curve with three electrocardiographic criteria for detecting LVH1, LVH2, and LVH3, the ROC curve for defining LVH1 using LVM indexed for BSA (LVMI) ≥125 g/m2 in males and ≥110 g/m2 in females; the ROC curve for defining LVH2 using LVM indexed for BSA (LVMI) ≥115 g/m2 in males and ≥95 g/m2 in females; the ROC curve for defining LVH3 using LVM indexed for BSA (LVMI2) ≥51 g/m2.7 in males and ≥47 g/m2.7 in females. N indicates P>0.05 and **indicates P<0.01.