
Figures & data
Table 1 Pearson’s correlations for baseline results without hearing aids
Figure 1 Structural equation model with R2 values and standardized path coefficients with significant (P<0.05) paths in bold.
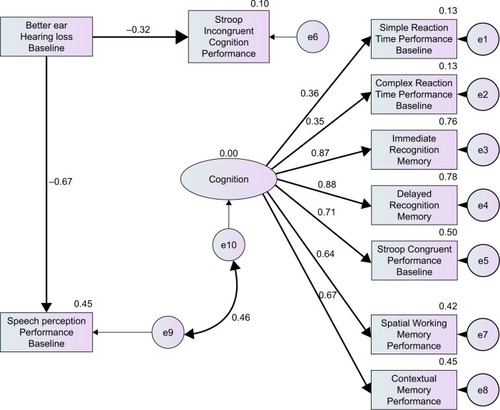
Table 2 Outcome of perceived hearing aid benefit
Figure 2 Experimental data and learning curves derived from speech tracking sessions for groups A and B.
Abbreviation: HA, hearing aid.
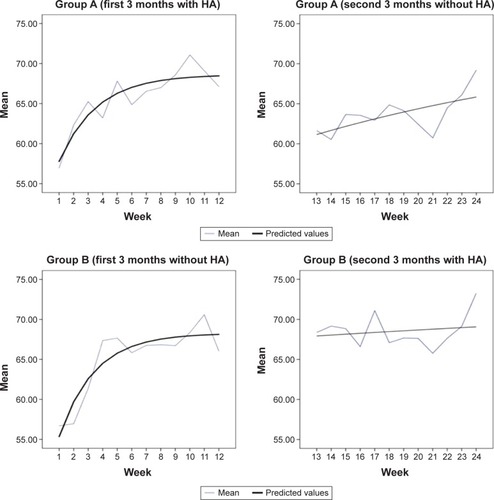
Table S1 Baseline characteristics
Table S2 Outcome of hearing aid benefit with respect to SPT results when HAs were first fitted and when HAs were removed
Table S3 Estimated parameters (standard errors) derived from speech tracking data
Table S4 Mixed model crossover analysis