
Figures & data
Figure 1 Recruitment strategy: numbers of research participants with dementia recruited to the Meeting Centres Support Group and the Usual Care Group in Poland.
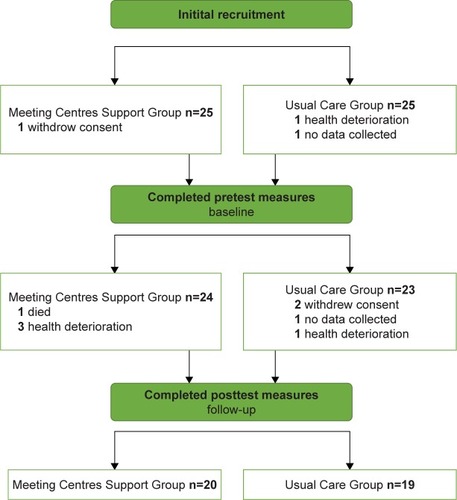
Table 1 Characteristics of people with dementia from MCSP and UC groups and their carers
Table 2 Average needs (met and unmet) and the level of support from the people with dementia (MCSP: n=24; UC: n=23) and their carers (MCSP: n=22; UC: n=20) perspective at baseline and follow-up (after 6 months)
Table 3 Changes in needs experienced by people with dementia (MCSP: n=24; UC: n=23) after 6 months – a multivariate general linear model with interaction between time and group
Table 4 Changes in experienced needs from the carers’ (MCSP: n=22; UC: n=20) perspective after 6 months – a multivariate general linear model with interaction between time and group
Table 5 Number of people with dementia (MCSP: n=24; UC: n=23) and carers (MCSP: n=22; UC: n=20) that reported unmet needs for each of the CANE areas at baseline and follow-up (after 6 months)