Figures & data
Table 1 Clinical characteristics of the study population by tertiles of NT-proBNP
Table 2 Clinical characteristics of the study population by tertiles of hs-cTnT
Figure 1 Kaplan–Meier survival curves for mortality based on tertiles of baseline values of hs-cTnT and NT-proBNP.
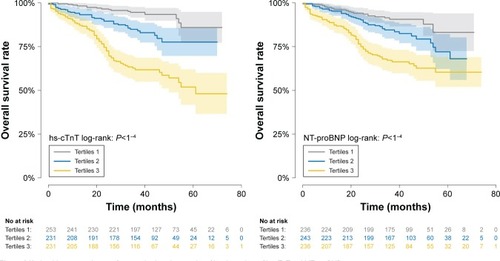
Table 3 Cox proportional regression analysis for mortality
Figure 2 Receiver-operating characteristic curves for NT-proBNP and hs-cTnT.
Abbreviations: hs-cTnT, high-sensitivity cardiac troponin T; NT-proBNP, N-terminal prohormone brain natriuretic peptide.
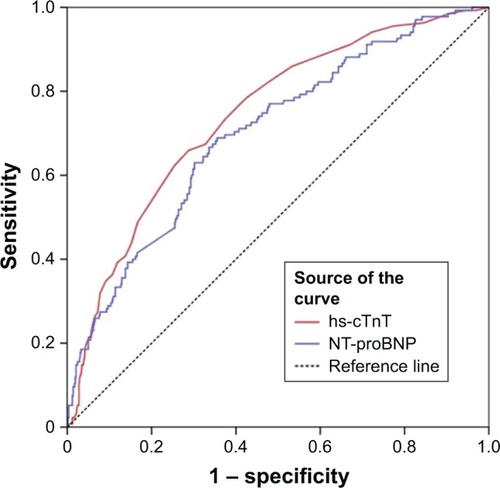
Figure 3 Time-dependent receiver-operating characteristic curve analysis for hs-cTnT and NT-proBNP.
Abbreviations: hs-cTnT, high-sensitivity cardiac troponin T; iAUC, incremental area under curve; NT-proBNP, N-terminal prohormone brain natriuretic peptide.
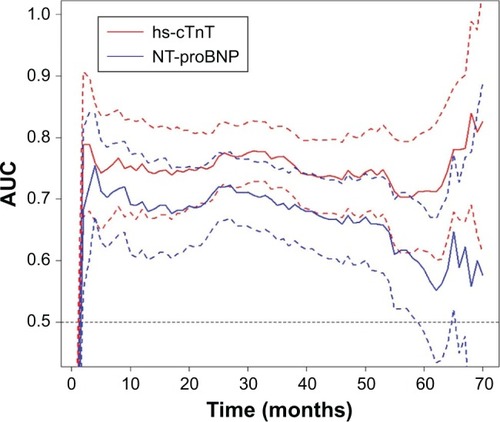
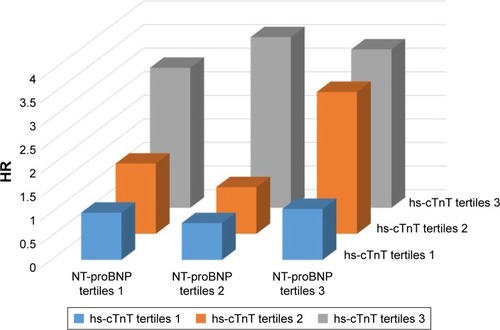
Table 4 Mortality by tertiles of hs-cTnT and NT-proBNP when considered together
Figure 4 Mortality based on the combination of hs-cTnT and NT-proBNP.