
Figures & data
Table 1 Characteristics of study participants
Table 2 The overlap between Fried’s criteria and REFS
Table 3 Associations between frailty and prolonged hospitalization
Figure 1 The Kaplan–Meier survival curves in frail and non-frail participants: (A) defined by Fried’s frailty criteria; (B) defined by REFS. Thin line: non-frail, thick line: frail.
Abbreviation: REFS, Reported Edmonton Frail Scale.
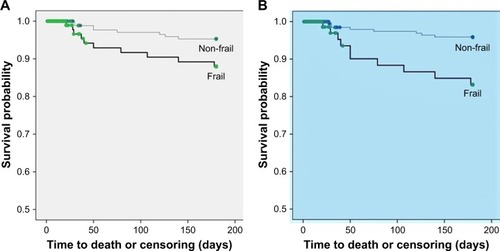
Table 4 Cox proportional hazards regression of factors related to all-cause mortality at 6 months in participants with available follow-up data (n=251)
Table S1 Univariate logistic regression of potential predictor factors for prolonged hospitalization and mortality at the sixth month