Figures & data
Figure 1 Pre- and postoperative FAZ measurement using a nonflow software in an 82-year-old male patient.
Abbreviation: FAZ, foveal avascular zone.
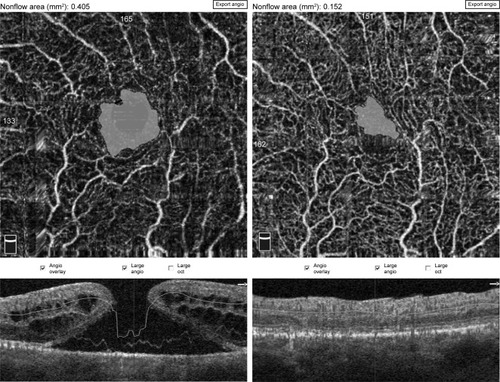
Figure 2 The fovea vessel density (FVDS) measured in superficial capillary plexus (SCP) using a density function on the imaging software.
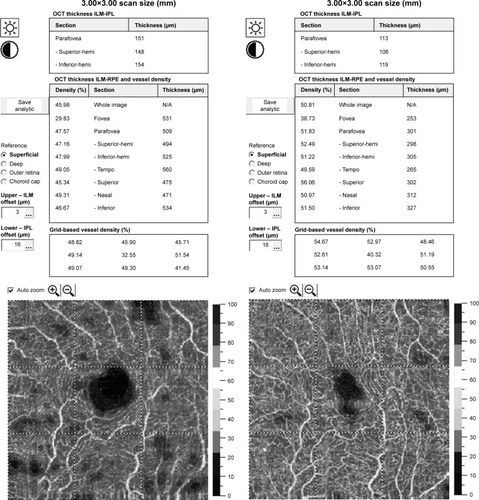
Figure 3 Pre- and postoperative choriocapillary flow area measurement using a flow tool of imaging software.
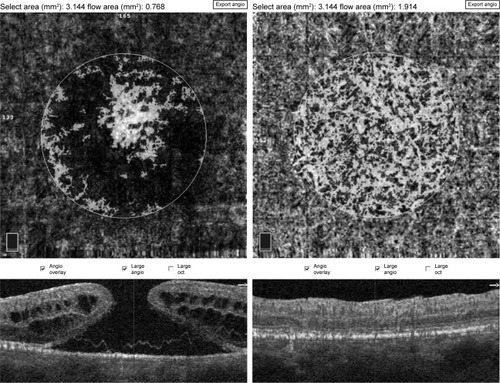
Figure 4 Pre- and post- operative OCTA of 82-year-old patient’s left eye.
Notes: (A) Preoperative OCTA report of 82-year-old male patient’s left eye showing numerous cystic changes in middle retina in en face scans. Macular basal hole size is 2,146 µm, minimum hole diameter is 427 µm. BCVA preoperatively was 0.08. (B) Postoperative OCTA scans of the same case as presented above. We observe in OCTA and en face scans the resolution of macular hole and adjacent cystic areas with normalization of foveal morphology and reduction of central retinal thickness. BCVA improved to 0.3 after surgery.
Abbreviations: BCVA, best-corrected visual acuity; OCT, optical coherence tomography; OCTA, optical coherence tomography angiography.
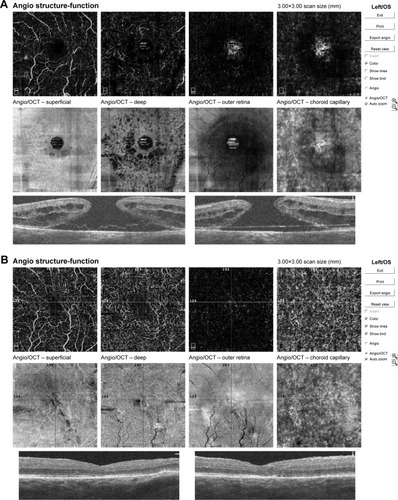
Figure 5 Pre- and post- operative OCTA of 75-year-old patient’s right eye.
Abbreviations: BCVA, best-corrected visual acuity; OCT, optical coherence tomography; OCTA, optical coherence tomography angiography.
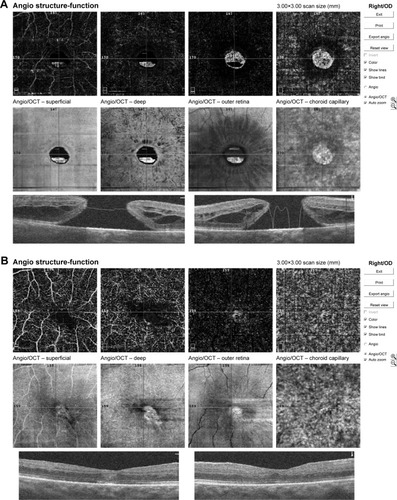
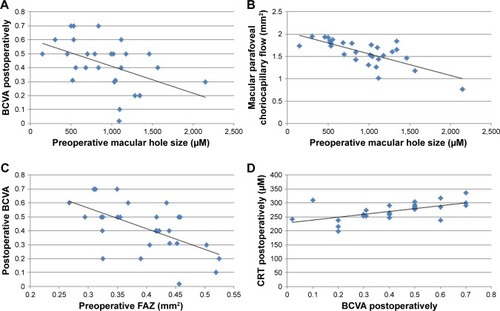
Figure 6 The r-Pearson correlation coefficient between the initial MHS and the BCVA.
Abbreviations: CRT, central retinal thickness; FAZ, foveal avascular zone.