
Figures & data
Figure 1 Study selection flowchart.
Abbreviation: ADL, activities of daily life.
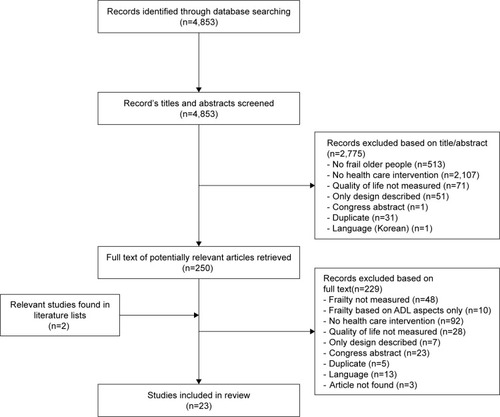
Figure 2 Methodological quality of the included studies, using the Cochrane collaboration’s tool for assessing risk of bias.
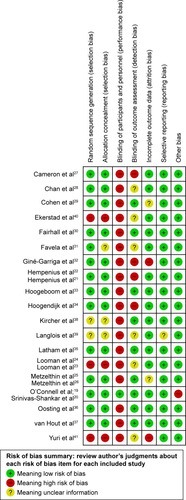
Figure 3 Risk of bias graph: review authors’ judgments about each risk of bias item presented as percentages across all included studies.
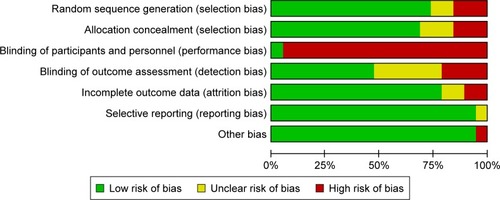
Table 1 An overview of the included studies, characteristics and outcomes