Figures & data
Table 1 Surgical operations for spinal degenerative diseases, by patients’ sex and age
Figure 1 Number of spinal operations for SDD, by age group.
Abbreviations: CDD, cervical degenerative disease; LDD, lumbar degenerative disease; SDD, spinal degenerative disease; TDD, thoracic degenerative disease.
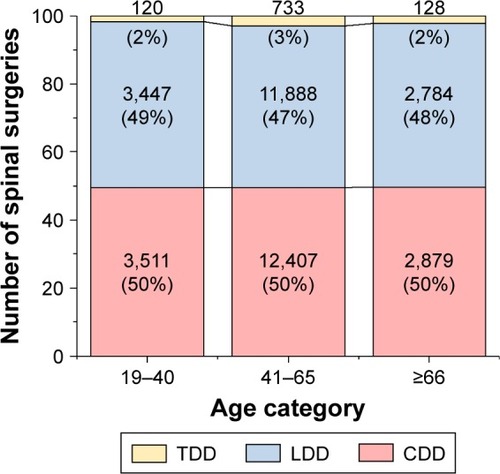
Figure 2 Proportion of SDD surgical operations performed on female patients, by the years of the study.
Abbreviation: SDD, spinal degenerative disease.
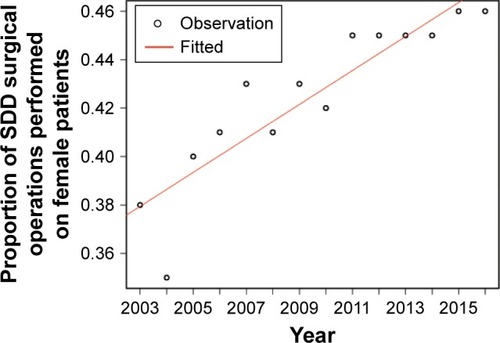
Figure 3 Mean age at surgery for SDD, by the year of the study.
Abbreviation: SDD, spinal degenerative disease.
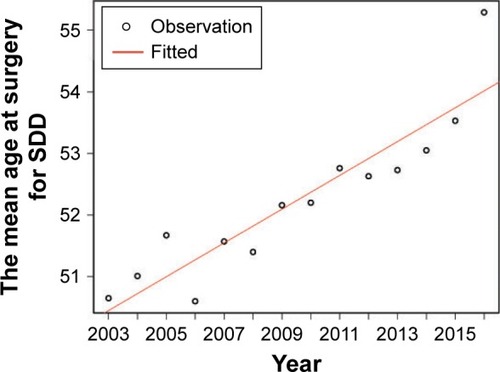
Figure 4 Mean hospital stay for postoperative SDD patients, by the years of the study.
Abbreviation: SDD, spinal degenerative disease.
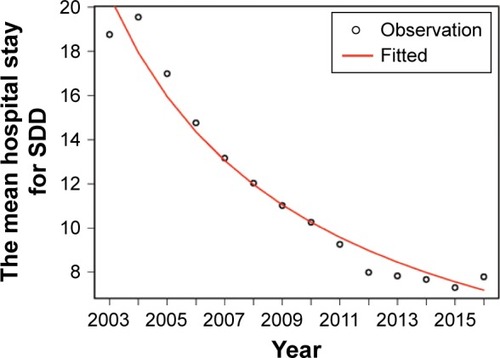
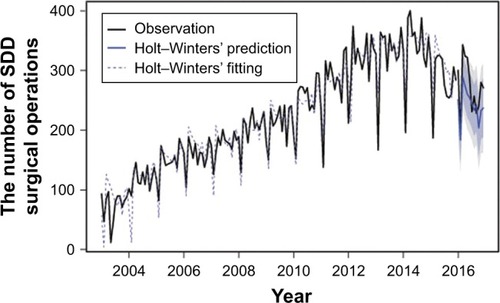
Figure 5 Number of observed, fitted, and predicted SDD surgical operations, by the year of the study.
Abbreviation: SDD, spinal degenerative disease.