
Figures & data
Figure 1 Flow chart of the dyads.
Abbreviations: n, numbers of dyads; IC, informal caregiver.
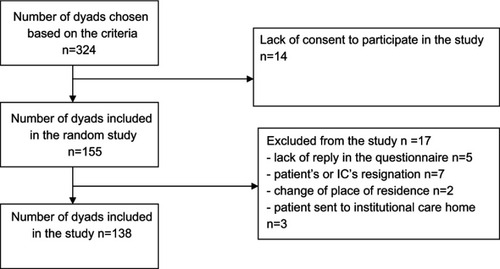
Figure 2 Quartile box plots for the WHOQoL-AGE scale.
Abbreviations: F1, subscale of satisfaction WHOQoL-AGE scale; F2, subscale of expectations fulfilment WHOQoL-AGE scale.
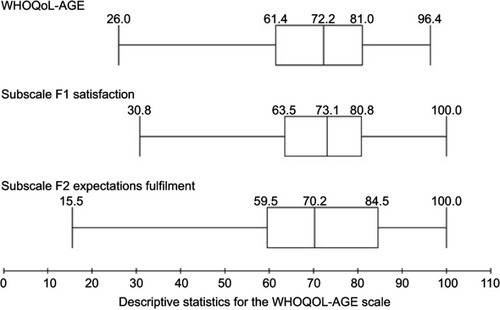
Table 1 Social and demographic characteristics of the IC (n=138)
Table 2 Social and demographic characteristics of the care-receivers being looked after by informal caregivers (ICs) (n=138)
Table 3 Model of selected conditions of IC's QoL consistent with the WHOQoL-Age in home care provided for individuals with chronic diseases and a functional performance deficit
Table S1 Selection process primary health care settings
Table S2 WHOQoL-AGE variables excluded in the model