
Figures & data
Table 1 Baseline characteristics comparing two clinic study subjects.
Table 2 Override reasons recorded when interacting with the Beers criteria EMR alert.
Figure 1 Legend: Patient visits, alert presentations, interaction rates and discontinuation rates over the 30-month study period. (A) Volume of patient care visits at two clinics, primary care (black bars) and a geriatrics clinic (grey bars). Each bar represents a month of data. (B) Volume of alert presentations in the two clinics. (C) Percent of alert presentations with any interaction (reminder performance) in primary care practice clinics (squares), geriatrics clinic reminder performance (circles). (D) Percent of alert presentations associated with a possible deprescribing event in primary care clinic (squares), or geriatrics clinic (circles).
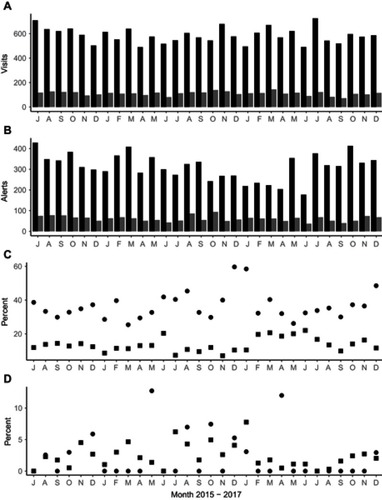
Table 3 Alerting burden and reminder performance measured by rates of interaction and discontinuation of alerting rules grouped by medication classes.