Figures & data
Table 2 The mean values of frailty syndrome and the individual domains depending on the response to CRT
Table 1 Characteristics of the patients that were included into the study
Figure 1 The ROC curves for frailty in the responders to CRT for all of the included patients.
Abbreviations: CRT, cardiac resynchronization therapy; ROC, receiver operating characteristic.
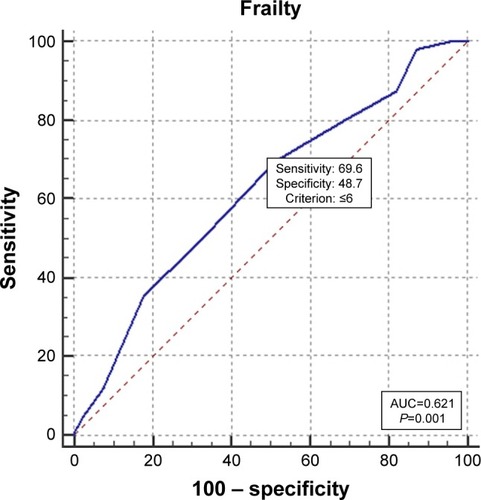
Figure 2 The ROC curves for frailty in the responders to CRT for men.
Abbreviations: CRT, cardiac resynchronization therapy; ROC, receiver operating characteristic.
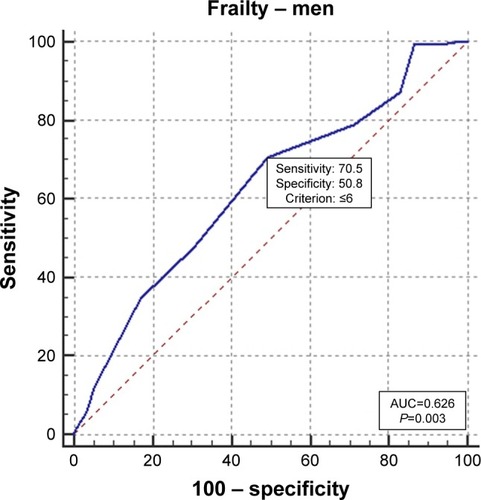
Figure 3 The ROC curves for frailty in the responders to CRT for women.
Abbreviations: CRT, cardiac resynchronization therapy; ROC, receiver operating characteristic.
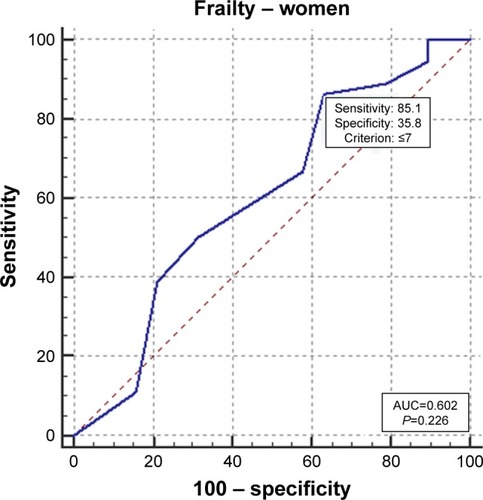
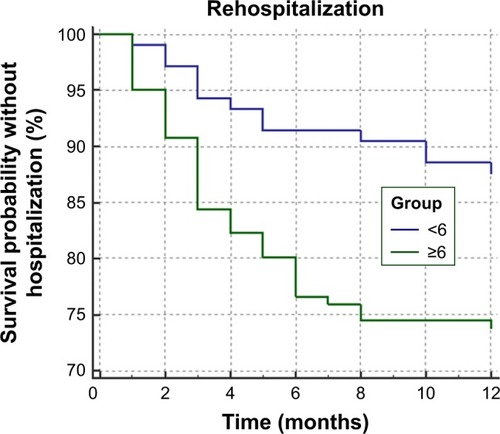
Figure 4 Survival probability without hospitalization in the Kaplan–Meier curves according to a score of 6 for frailty.