
Figures & data
Figure 1 Tongue-pressure resistance training.
Notes: The straight line is the palate, the dashed line is the tongue surface, and the white circles represent the hyoid bone. The left panel shows the resting position. The right panel shows the elevated hyoid with the tongue pushing against the palate as hard as possible.
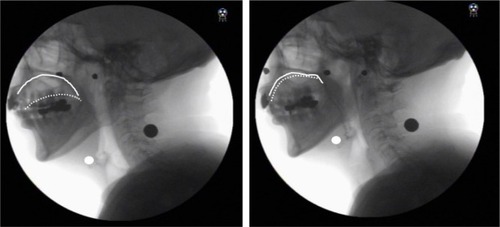
Figure 2 Lateral radiogram demonstrating the x- and y-axes.
Notes: A coordinate system was established with the y-axis forming a straight line connecting the lower edges of the second (white triangle) and fourth cervical vertebrae (black triangle) and x-axis forming a straight line drawn perpendicular from the lower end of the fourth cervical vertebra. The white circle indicates the hyoid bone. The distances between the maximum anterior-superior hyoid elevation and the hyoid position at the onset of elevation were defined as anterior and superior movement along the x- and y-axes, respectively. The extent of hyoid movement was normalized by dividing by the length of a straight line connecting the lower ends of the second and fourth cervical vertebrae on the y-axis.
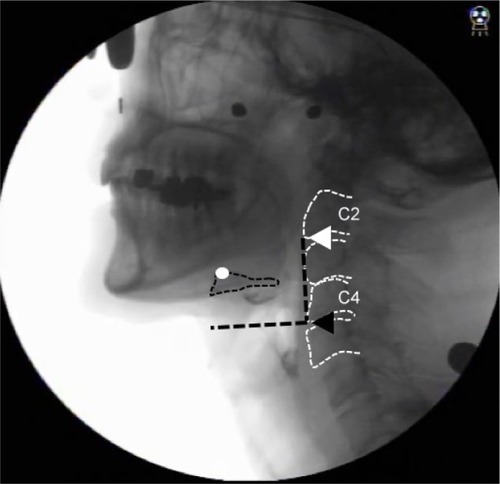
Figure 3 Example of pixel-based measurement of pharyngeal residue in the piriform sinus.
Notes: The black line is the spatial housing area, the white area is residue area, and the dashed line is the length from C2 to C4. For example, the normalized residue ratio scale in the piriform sinus (NRRSp) was calculated as follows: NRRSp = (residue area/housing area) × (residue area/[the length C2 to C4]Citation2×10).
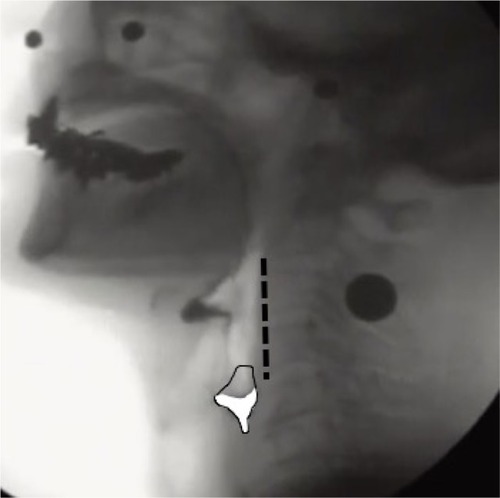
Table 3 Correlations between PAS scores and NRRS and the other variables
Table 2 Pre- and post-exercise swallowing function comparison
Table 1 Pre- and post-exercise comparison of hyoid bone kinematics